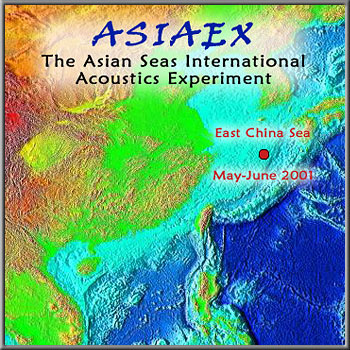
The Asian Seas International Acoustics Experiment (ASIAEX)
East China Sea
 The Asian Seas International Acoustics Experiment (ASIAEX) East China Sea |
ASIAEX East China Sea Program Overview The goals of ASIAEX, East China Sea:
An article from the 2003 Biennial Report of the Applied Physics Laboratory The final symposium of the ASIAEX program included 60 representatives from four countries who presented results of the field programs conducted in the spring and summer 2001. Wind and Wave Environmental Data |

Questions about ASIAEX East China Sea? Contact Peter Dahl |
|||
Wind Speed Data Wind speed and wind direction data are in the matfile ECSwind_dir.mat, which contains three vectors: JD (for Julian decimal day, e.g., 148.5-1200 28 May, GMT), SPEED (30-minute averaged wind speed in m/s), DIR (wind direction [from] in deg.). The data originate from the R/V Melville's IMET station, and wind direction has been corrected for ship's heading. Wave Buoy Data About the wave buoy data and how to use it... The local sea state was measured using a 0.9-m diameter TRIAXYS directional wave buoy. The directional wave buoy measured waveheight variance spectra in 0.005-Hz bins from 0.03 Hz to 0.64 Hz, and in 3-degree directional bins. Spectra were computed every 0.5 h based on a 20-min averaging time, and the data were sent back to the Melville via a RF modem link. The buoy operated between 2230 on 28 May and 0030 on 8 June (all times GMT). |
The NONDIRSPEC data are organized by day, e.g., the file 20010601.NonDirSpec contains all the data taken on 6 June. All ASCII data for a given day are concatenated into a single column. A given spectrum is indicated by a row giving the measurement time in GMT (e.g., 01/06/2001 00:25:07 NB: the day is given first in this format). The next three rows give the frequency specification: (123) frequency bins starting at (.03) Hz and separated by (0.005) Hz. The next 123 rows are the non-directional surface wave spectral values with dimension meters2/Hz. The process is then repeated, starting with the listing of measurement time. The DIRSPEC data are organized into separate folders for each day. Within each folder are separate files corresponding to each directional wave measurement, e.g., file 200106010030.DIRSPEC is the directional wave spectrum recorded 0030 on 1 June GMT. (This file corresponds to the non-directional data with time stamp 01/06/2001 00:25:07) A Matlab program, written by Peter Dahl, will read and plot these files. An example of such a plot is shown in Fig. 6 of APL-UW TM 7-01. To download plotdirspec.m (3K file), right click on the mouse and choose "Save Link As..." for Netscape, or "Save as" for Internet Explorer. Once the file is saved locally, repeat process for any of the files in the data sets. To run the script, from Matlab choose "Open file"... |
|||