The Asian Seas International Acoustics Experiment (ASIAEX)
East China Sea
 The Asian Seas International Acoustics Experiment (ASIAEX) East China Sea |
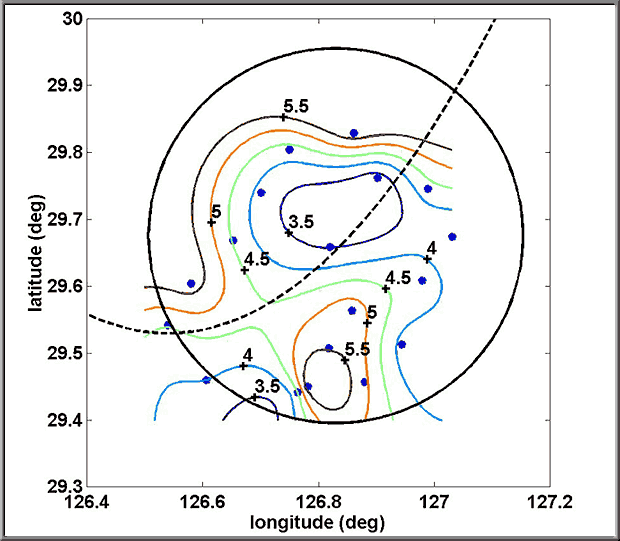
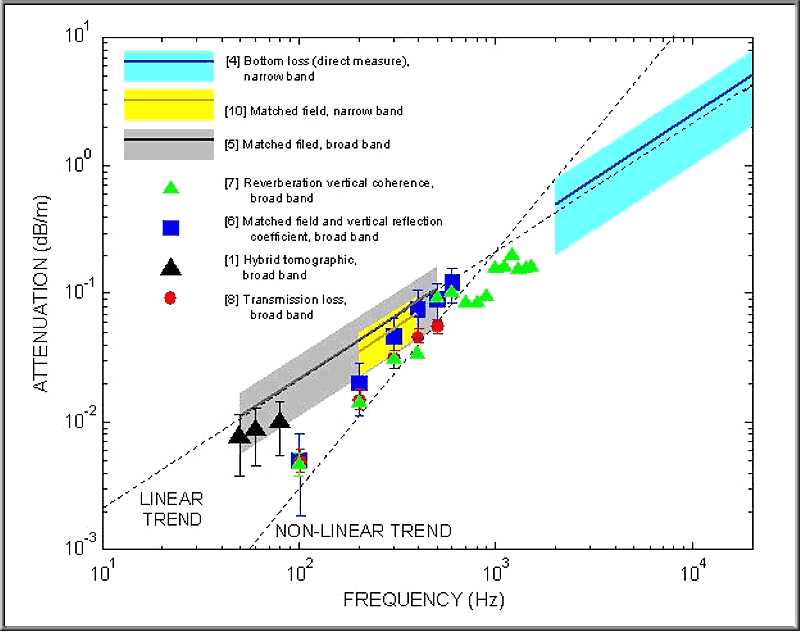
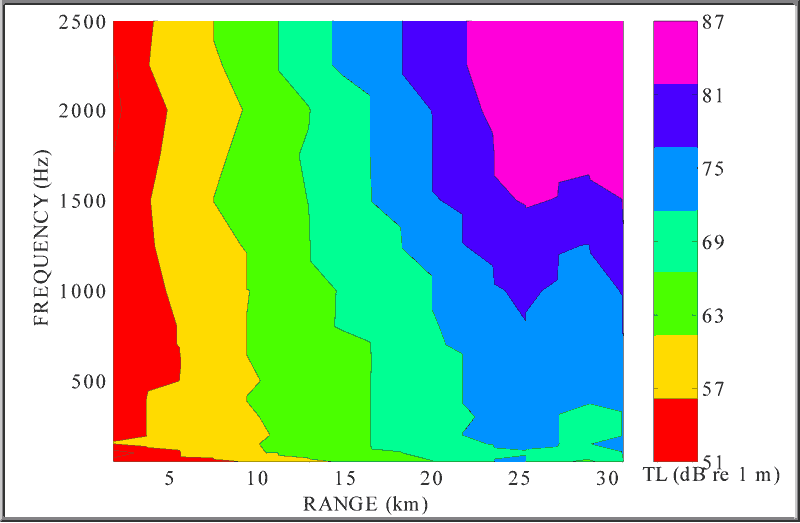
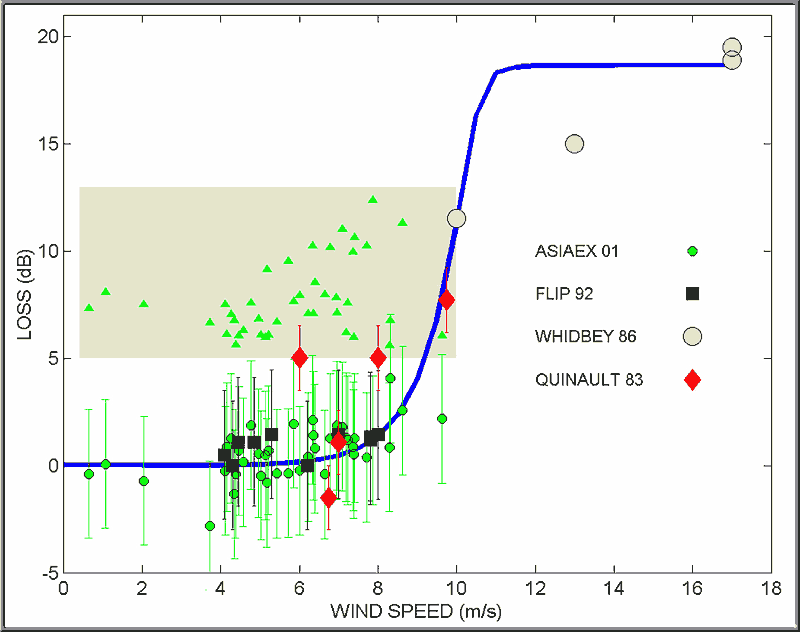
The following is excerpted by Peter H. Dahl from a paper with same title, by Peter H. Dahl, Renhe Zhang, James H. Miller, Louis R. Bartek, Zhaohui Peng, Steven R. Ramp, Ji-Xun Zhou, C. S. Chiu, James F. Lynch, Jeffrey A. Simmen, and Robert C. Spindel. The full paper is scheduled to be published in IEEE Journal of Oceanic Engineering, special issue on Asian Marginal Seas. Papers cited here and also scheduled for the same issue are identified in the reference section as IEEE J. Oceanic. Eng., 2004 (Special Issue). Introduction Environmental Characterization Initial Results Concluding Remarks and Acknowledgements References Tables Figures ASIAEX ECS Home The centerpiece of the Asian Seas International Acoustics Experiment (ASIAEX) consisted of two major field programs conducted in the spring of 2001, one in the South China Sea and the other in the East China Sea. This short note provides a brief overview of the ASIAEX East China Sea (ECS) program, conducted under the auspices of the U.S. Office of Naval Research and the Natural Science Foundation of China. The U.S., Chinese, and Korean research organizations involved in the 2001 ECS field program are listed in Table 1. The primary goals of ASIAEX East China Sea (ECS) were to (1) identify and elucidate properties of shallow-water boundaries governing propagation and reverberation in the ECS, such as sediment inhomogeneity, sediment roughness, and sea surface roughness; and to (2) establish a geoacoustic description for the ECS seabed, based on complementary approaches to inverting acoustic propagation and reverberation measurements made in the O(10–10000 Hz) frequency range. The ECS study area, jointly approved by the State Oceanic Administration of the People's Republic of China, and the Japanese Ministry of Foreign Affairs, was a box defined by 28° to 30° N and 126° 30' to 128° E. Participating in the main 2001 experiment were the U.S. research vessel Melville, and two Chinese research vessels, the Shi Yan 2 and Shi Yan 3. Leading up to the 2001 field program in the ECS was a pilot study conducted in the spring of 2000 from the U.S. R/V Revelle aimed at obtaining environmental data within this boxed area to support the acoustics experiments planned for 2001 (see Table 2 for the list of organizations involved in the 2000 pilot study). Information on the ECS seabed and subbottom structure derived from this pilot study (see [1]) was used to select from the approved ECS box a preferred study area for the main experiment in 2001. The center point of this preferred area (Fig. 1), located at 29° 40.67'N and 126° 49.39'E, is referred to as position M and is located in the NW corner of the approved box about 500 km east of the Chinese coastline belonging to Zhejiang Province. Position M became the designated center of a 30-km-radius circular transect over which broadband acoustic sources were deployed for the long-range propagation and bistatic reverberation experiments in 2001; sources were also deployed along a straight cross-shelf transect of 100 km. The area encompassed by the 30-km radius circle, known as the large-scale ECS experimental site, was the primary site for low-frequency, O(10–1000 Hz), propagation and reverberation studies. A subset area of approximately 10 km2, centered at position M, was the laboratory for mid-to-high frequency, O(1–10 kHz), studies. The approach of embedding mid-to-high frequency acoustic experiments within an area where low-frequency experiments were also conducted served two purposes. The first was to more efficiently allocate limited resources for seabed sampling; for example, the area immediately surrounding position M received substantially more emphasis insofar as coring and measurements of fine-scale bottom relief. The second was to conduct multiple-frequency geoacoustic inversions on the same area of seabed. That is, the inner region about position M was studied using a wide range of frequencies, O(10–10000 Hz). The lower end of this band yielded low-resolution but deep, O(10 m), information about the sediment; the higher end of this band yielded little or no information on the deep sediments, but provided better resolution on upper sediment structure (e.g., layering). A key objective of ASIAEX ECS was to fuse inversion results from such frequency-complementary acoustic experiments. Go to: Introduction Environmental Characterization Initial Results Concluding Remarks and Acknowledgements References Tables Figures ASIAEX ECS Home Environmental Characterization a. Seabed Within the 30-km-radius circle (Fig. 1), sediment cores were collected as part of the environmental assessment in 2000 and also during main experiment in 2001. Analysis [1] of these data suggests a compressional wave speed in the surface sediment layer varying from near 1600 m/s at core stations located in the northwest quadrant of the 30-km circle, to near 1650 m/s at some stations in the vicinity of the circle's center. The spatial distribution of mean grain size (Fig. 2) points to variation on scales much smaller than that originally depicted by an historical mud-sand boundary discussed in [1]. The sediment porosity and fine-scale relief measurements made within a 4-m measurement aperture put the seabed rms relief at 0.5 cm in the vicinity of position M [2]. A photograph (Fig. 3) taken from the instrument shows an example of the indentations from bottom-dwelling organisms that are postulated to be responsible for the fine-scale relief, and a bioturbation model in [2] reproduces well the observed mean roughness spectrum (Fig. 3). These measurements are necessarily a high-pass filtering of relief, and do not capture variability at length scales greater than about 2 m, but are essential for modeling acoustic backscatter in a mid-frequency (3–4 kHz) range. b. Volume During the main 2001 experiment, sound speed in the water column was measured by CTD (conductivity, temperature, depth) casts from the Melville and the Shi Yan 3. Typical time variation in the sound speed profile for the East China Sea in late spring (Fig. 4) shows the dominant component of the variance linked to the semidiurnal (M2) internal tide oscillation of the thermocline. A comparison of a 24-h average of this data (Fig. 4) with an equivalent average of sound speed profile taken in the Yellow Sea in August 1996 shows that the late-spring thermocline in the ECS is truly weak when compared with the late-summer thermocline in the Yellow Sea; the acoustic implication is that the sea surface has a greater influence for propagation and reverberation in the ECS than in the Yellow Sea. Detail and discussion on the salinity and temperature profiles and the internal wave characteristics of the ECS are in [3]. c. Sea Surface Between 29 May and 7 June 2001, wind speed varied from near 1 to 13 m/s and the rms wave height varied between about 0.1 and 0.6 m, which indicated a wide range of sea state conditions for the ASIAEX ocean acoustic experiments conducted in the East China Sea (Fig. 5). Go to: Introduction Environmental Characterization Initial Results Concluding Remarks and Acknowledgements References Tables Figures ASIAEX ECS Home Initial Results Considerable progress has been made towards establishing a geoacoustic description of the ECS seabed [1,4–10], based on complementary approaches to inversion. It is important to keep in mind the diversity of acoustic field measurements, representing 1-way propagation and 2-way reverberation, made at frequencies ranging from O(10–10000 Hz), that have been utilized for these geoacoustic inversions; such measurements interrogate the seabed in fundamentally different ways. Still, a fair degree of consistency has emerged. For example, the range of inverted sound speeds corresponding to the water-sediment interface is 1557–1643 m/s; at a depth of 0.5 m this range is 1590–1643 m/s, and at a depth of 1 m it is 1600–1650 m/s. In regards to sediment attenuation in the East China Sea, the ASIAEX results (summarized in Fig. 6) display both a linear and non-linear trend for attenuation as a function of frequency in the 50–500 Hz frequency range. At this writing, the results in Fig. 6 point to more questions than answers. Clearly, understanding and reconciling this difference poses a challenge for follow-on analysis of ASIAEX data or for future experiments conducted in this same ECS region. It will also be efficacious to combine in future work ASIAEX inversion results that are complementary in their frequency dependence. For example, assigning geoacoustic estimates obtained at higher frequencies to the region near the water-sediment interface and geoacoustic estimates obtained at lower frequencies to deeper sediment regions should produce a geoacoustic model for the ECS that is robust over a broad frequency range. The transmission loss data for ASIAEX East China Sea described in [8], made along the three, 30-km length radials EM, FM and GM (Fig. 1), will be particularly valuable for future benchmarking. Figure 7 displays for the GM radial a subset of this data in the form of transmission loss estimates in dB re 1 m versus range for third-octave center frequencies between 40 and 2500 Hz. In terms of the role of sea state in governing the strength and coherence of shallow-water acoustic propagation and scattering over frequencies of O(100–10000 Hz), the following results have emerged thus far. Energy loss in forward scattering from the sea surface associated with wind-speed dependent bubbles was measured over long (24 h) periods during ASIAEX [11]. Dependence of this kind of loss on wind speed is not clearly evident with the ASIAEX data alone, however when combined with the archival data the dependence is clear (Fig. 8). In contrast to coherent surface loss, incoherent loss (or energy loss) as exemplified by the ASIAEX data in Fig. 8 was small and difficult to precisely measure against ordinary statistical fluctuation, for wind speeds up to about 8 m/s. Figure 8 also illustrates for the ASIAEX conditions and measurement geometry, the poor correlation between energy loss and the parameter χ = 2kHsin Θ, where k is wave number, H is rms wave height, and Θ is the nominal sea surface grazing angle. More closely linked, however, with wave spectral properties is the spatial coherence of sound forward scattered from the sea surface, which was also measured. The measurements have been modeled with an approach that utilizes the van Cittert-Zernike theorem [12] in conjunction with the simultaneously measured sea surface spectral wave properties. The concept of a coherence volume, having applications in underwater acoustic imaging and communication, follows from this approach: for the ASIAEX acquisition geometries and surface conditions and for a 20-kHz source at a depth of 25 m and range of 0.5 km, a coherence volume exists for receivers between depths of 25 m and 50 m. This coherence volume relates to the spatial coherence of the sound field arriving via the surface bounce channel and consists of a vertical layer 0.5 m thick and 3 m in each of the two horizontal dimensions, or equivalently, 4–5 m3. The experimental observations in [13] show that the significant change in sea surface conditions between June 3 and June 5 (see Fig. 5) impacted the broadband [50–1000 Hz] reverberation during this period. Specifically, significantly higher (order 5 dB) mean reverberation levels were observed on June 3, when the rms wave height was 0.10 m and wind speed was lower (3 m/s), than on June 5, when the rms wave height was 0.34 m and the wind speed was 9 m/s. Mechanisms for this change associated with 2-way propagation and reflection loss from the sea surface have been proposed [13]. Whether or not the sea surface has a significant effect on the fidelity of geoacoustic inversions will depend on the sea state, the frequency range, and acoustic measure being inverted. We note that the completed inversion studies reported in this volume involving long-range propagation and multiple boundary interaction have not, as is common, addressed this issue per se. Yet, emerging studies [14] suggest, for example, that the aforementioned June 3-to-June 5 change in sea state does impact inversion results. It remains a challenge for future studies involving the ASIAEX ECS data to elucidate and distinguish first order, and higher order, influences of the sea surface on geoacoustic inversion results and uncertainties. Go to: Introduction Environmental Characterization Initial Results Concluding Remarks and Acknowledgements References Tables Figures ASIAEX ECS Home Concluding Remarks and Acknowledgements The results summarized here, and presented in greater detail in the IEEE J. Oceanic Eng. Special Issue, can only be regarded as a subset of the results expected to ultimately emerge from the ASIAEX East China Sea program. Taken together, this diverse set of ocean acoustic measurements, spanning a frequency range from tens of Hz to several kHz and representing a large range of temporal and spatial scales, will be brought to bear towards an improved understanding of shallow-water acoustics. Primary guidance and sponsorship for ASIAEX East China Sea came from the Office of Naval Research. Significant financial contributions were also received from sponsoring agencies within China. References [1] James H. Miller, Lous R. Bartek, Gopu R. Potty, Dajun Tang, J. Na, and Y. Qi, "Sediments in the East China Sea ," IEEE J. Oceanic Eng., 2004 (Special Issue). [2] D. J. Tang, "Fine-scale measurements of sediment roughness and subbottom variability," IEEE J. Oceanic Eng., 2004 (Special Issue). [3] Jie Yang, Shihong Zhou, Ji-Xun Zhou and James F. Lynch, "Internal Wave Characteristics at the ASIAEX site in the East China Sea," IEEE J. Oceanic Eng., 2004 (Special Issue). [4] Jeewoong Choi and P.H. Dahl, "Mid to High Frequency Bottom Loss in the East China Sea," IEEE J. Oceanic Eng., 2004 (Special Issue). [5] Kunde Yang, Yuanliang Ma, Chao Sun, James H. Miller, and G. R. Potty, "Multi-step Matched Field Inversion for Broadband Data from ASIAEX2001," IEEE J. Oceanic Eng., 2004 (Special Issue). [6] Zhenglin Li, Renhe Zhang, Jin Yan, Fenghua Li and Jianjun Liu, "Geoacoustic inversion by matched-field processing combined with the vertical reflection coefficients and vertical correlation," IEEE J. Oceanic Eng., 2004 (Special Issue). [7] Ji-Xun Zhou, Xue-Zhen Zhang, P. H. Rogers, J. A. Simmen, P. H. Dahl, Guoliang Jin, and Zhaohui Peng, "Reverberation Vertical Coherence and Seabottom Geoacoustic Inversion in Shallow Water," IEEE J. Oceanic Eng., 2004 (Special Issue). [8] Zhaohui Peng, Ji-Xun Zhou, Peter H. Dahl and Renhe Zhang, "Seabed acoustic parameters from dispersion analysis and transmission loss in the East China Sea," IEEE J. Oceanic Eng., 2004 (Special Issue). [9] H. L. Ge, H. F. Zhao, X. Y. Gong and E. C. Shang, "Bottom reflection phase shift estimation from ASIAEX data," IEEE J. Oceanic Eng., 2004 (Special Issue). [10] Chen-Fen Huang and William S. Hodgkiss, "Matched Field Geoacoustic Inversion of LowFrequency Source Tow Data From the ASIAEX East China Sea Experiment," IEEE J. Oceanic Eng., 2004 (Special Issue). [11] P. H. Dahl, "The Sea Surface Bounce Channel: Bubble-Mediated Energy Loss and Time/Angle Spreading ," In: High-Frequency Ocean Acoustics Conference, La Jolla, CA, March 2004. [12] P. H. Dahl, "Forward Scattering from the Sea Surface and the van Cittert-Zernike Theorm," J. Acoust. Soc. Am., 115 (2), 589-599, 2004. [13] Fenghua Li, Jianjun Liu, and Renhe Zhang, "A model/data comparison for shallow water reverberation ," IEEE J. Oceanic Eng., 2004 (Special Issue). [14] Ji-Xun Zhou, Xue-Zhen Zhang, Peter H. Dahl and Jeffrey A. Simmen, "Sea surface effects on reverberation vertical coherence and inverted bottom acoustic parameters," In: Proceedings 147th Meeting of the Acoustical Society of America, J. Acoust. Soc. Am., 115, 2004. Go to: Introduction Environmental Characterization Initial Results Concluding Remarks and Acknowledgements References Tables Figures ASIAEX ECS Home
Table 2. List of research institutions involved in the 2000 ASIAEX East China Sea pilot study program.
Go to: Introduction Environmental Characterization Initial Results Concluding Remarks and Acknowledgements References Tables Figures ASIAEX ECS Home  Fig. 1. Location of the ASIAEX East China Sea experimental site; clockwise from left large-scale view reducing to small scale (lower right) showing positions of the R/V Shi Yan 3 and R/V Melville near position M, and the outbound course of the R/V Shi Yan 2. Yellow circles in lower right panel show first three locations for deployment of broad band acoustic sources by the Shi Yan 2. The circle about the Shi Yan 3 has a radius of 1 nm.  Fig. 2. Contours of the spatial distribution of mean grain size in phi units, based on the coring locations shown by the blue dots. Lower phi values indicate more sandy-like sediments, and higher phi values indicate more mud-and-sand-like sediments. The circle has radius 30 km with position M at center; dashed line is the historical mud-sand boundary discussed in [1] with sand to the southeast and mud-sand to the northwest. Figure adapted from ref. [1], and courtesy of Jim Miller, URI.  Fig. 3. Photograph of seabed taken near position M, showing an example of indentations from bottom-dwelling organisms that are postulated to be responsible for the small-scale relief. (b) Measured spectra of seabed relief (colored lines) taken near position M, the average spectrum (dashed, black line), and model [2] for the average spectrum (solid, black line). Figures are adapted from ref. [2], and courtesy of Dajun Tang, APL-UW.  Fig. 4. (a) An example of the time variation in the sound speed vertical structure for the East China Sea taken at position M, starting UTC 1200 on 2 June (Julian day 153), as measured by CTD. (b) A 24-h average of the data in (a), compared with an equivalent average of sound speed versus depth taken in the Yellow Sea in August 1996. Thick, blue line is 24-h average; thin, black lines are individual CTD measurements made hourly.  Fig. 5. Time history of the wind and sea surface waves made during ASIAEX East China Sea. Wind speed was measured from the R/V Melville's IMET station and wave data were measured with a TRIAXYS directional wave buoy positioned approximately 500 m from the Melville. Top: Contour of directional averaged wave spectra (see [12] for example of directional wave data), taken every 0.5 h, with white dots showing location of peak frequency. Middle: Time series of rms waveheight, along with approximate time windows for acoustic experiments (symbol key bottom of figure). Bottom: Time series of wind speed; note that wind speed data continue slightly beyond the wave buoy recovery time.  Fig. 6. Results of inversion for sediment attenuation in the East China Sea. Legend gives brief description of inversion approach, with broad band and narrow band defined as in Section II; reference numbers refer to the reference list.  Fig. 7. Transmission loss in dB re 1 m as a function of range Position M along track MG (Fig. 1), and 1/3-octave bandwidth center frequency (data from [8]). Source and receiver depth each 50 m.  Fig. 8. Estimates of energy loss for a single interaction with the sea surface as a function of wind speed for a nominal sea surface grazing angle of 9° and frequency 20 kHz. Results from ASIAEX and three other experiments are shown (year of experiment identified in legend, additional information given in [11]). Solid curve is model for energy loss (in [11]) due to attenuation from near-surface bubbles; model reaches a bound-phase (associated with bubble scattering) for wind speeds greater than about 12 m/s. Shaded area shows estimates of the non-dimensional parameter χ versus wind speed (plotted on same scale) corresponding to each ASIAEX loss estimate. This figure is an adaptation of a similar figure in [11], which does not include the χ data. Go to: Introduction Environmental Characterization Initial Results Concluding Remarks and Acknowledgements References Tables Figures ASIAEX ECS Home |