
|
 |
Dolce Vita 2—Cruise Report
—filed by Dr. Craig Lee on 10 June 2003
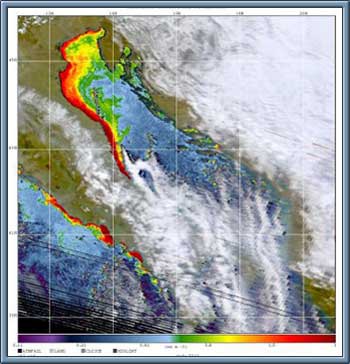
The R/V Knorr sailed from Ancona, Italy on 26 May with a team of scientists from American, Italian, Croatian, and Austrian institutions. In contrast to the wintertime study of response to strong atmospheric forcing, springtime investigations focused on a period when riverine buoyancy flux (the spring freshette) normally dominates the northern and central Adriatic. As before, we utilized near-real time remotely sensed sea surface temperature and ocean color (provided by the Ocean Color Group at NRL Stennis Space Center and the Remote Sensing Group at OGS-Trieste) to direct sampling toward specific fronts and filaments (Figure 1). Specialized meteorological forecasts were provided by Dietmar Thaler (Austrian Military Weather Service) and Dr. Vlasta Tutis (Croatian Meteorological Service). This continuous information stream allowed us to refine sampling strategies and focus effectively on rapidly evolving mesoscale variability.
 |
|
|
Forcing during the spring measurement period has been weak to non-existent. Climatologically, we expected to sample during the spring freshette, but recent data (supplied by Nello Russo, Univ. of Ancona, shortly after we sailed) place the discharge strength at approximately 30% of normal (for the spring freshette). Likewise, wind forcing has been extremely weak. We experienced a (weak) Sirocco about one week into the cruise, but for the most part it has been so calm that the sea is like glass. As expected, the entire basin is stratified, with very shallow (0-5 m) mixed layers and significant stratification throughout the water column. The upshot is that, without strong forcing to organize the circulation, we've been sampling weak, small scale flows dominated by internal dynamics. One striking find was the presence of small-scale T-S interleaving features in many parts of the basin.
We began with a couple of sections across the northern basin to shake out the various instruments and to scout the 'Istria front' (Figure 2). Remotely sensed SST provides little information this time of year, as the entire basin is surface capped. Ocean color is a bit better, though the Po plume dominates the variability. The April/May SACLANTCEN/NRL cruise found a subsurface front at the same location where we observed the 'Istria front' last winter, though the feature was considerably weaker. We observed a weak front in this region (Figure 3), probably formed by a filament of cooler water extending from Kvarner Bay.
 |
|
|
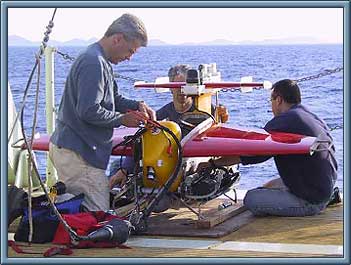
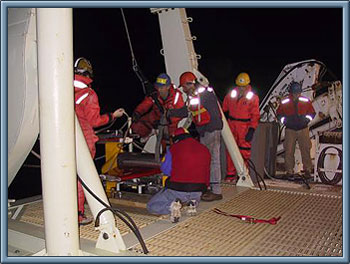
| Tim McGinnis, Eric Boget and Jason Gobat preparing TriSoarus for deployment.
|
|
|
Similar to wintertime conditions, the Mid-Adriatic Filament (MAF) did not appear in the remote sensing, though previous studies suggested that it might be present. We executed a 24-hour survey over the Jabuka Pit which revealed a distinct westward current (the MAF?) embedded in an energetic, highly variable flow field. The MAF turned westward while still over deep water, well before the bathymetry shoaled. Pierre's drifters and our own data suggest that inertial motions may be significant. With only weak wind forcing this seems a little odd, though even weak winds may be sufficient to accelerate the extremely thin surface layer. Given the potential importance of inertial motions and our concerns that the lateral scales might be quite small, we executed a rapidly repeated survey (~6 hours each with 6 occupations) spanning the MAF. This should allow us to assess MAF dynamics and provide a rough characterization of inertial variability. Within this region the optical distribution was characteristic of a seasonal subsurface chlorophyll maximum at about 75 meters (Figure 4), as well as a deep non-phytoplankton particle and CDOM layer apparently associated with northern Adriatic deep water formed during the winter. We also occupied a section running through the deepest regions of the Jabuka Pit, in an attempt to investigate the paths followed by North Adriatic Deep Water (Figure 6).
 |
|
|
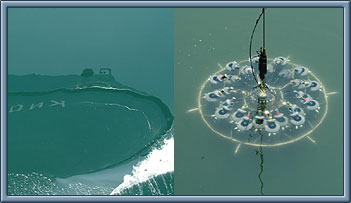
A contrast in surface waters—on the eastern side of the basin, clear, blue water and near the Po delta (western side) surface waters were green and murky, a combination of high phytoplankton content and suspended inorganic material.
|
|
|
Following this, we transited to the Istrian coast, where we sampled the remnants of a filament that had extended from Kvarner Bay. Though there was a clear salinity front accompanied by optical variability (Figure 3), we couldn't avoid comparisons with the dramatic front we sampled here during the previous winter. There were weak increases in optical signals north of the front with both higher absolute absorption and also higher absorption/attenuation ratios indicative of increased phytoplankton abundance. However, throughout the area both attenuation and CDOM fluorescence increased near-bottom indicating a layer of elevated particle and CDOM concentrations.
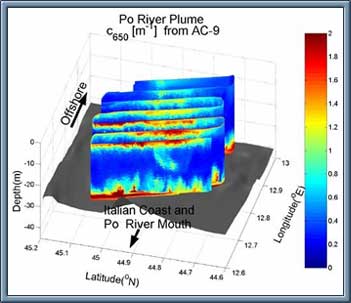
Over the past few days, we've been working at the mouth of the Po, studying the outflow region during a period of weak discharge. Sampling has included two orthogonally-oriented TriSoarus surveys and an intensive daytime section of CTDs and optical profiles. The attenuation at 650 nm from the first Po survey is shown in Figure 5. Next, we intend to run an extended pattern, executing cross-shelf TriSoarus sections between the Po Delta and the Jabuka Pit. During this period, we will choose an instability somewhere along the Po plume (the best candidate at this time is a pair of filaments extending over the Jabuka Pit) for a final, focused three-day study.
|
|
 |
|
|
Figure 1. Cruise tracks as of 10 June 2003.
|
|
|
 |
|
|
Figure 2. A MODIS ocean color image (provided by NRL- Stennis Space Center) from 7 June 2003.
|
|
|
 |
|
|
Figure 3. A section across the Istria front, running north to south. Data have not been lag-corrected, and hysteresis is thus apparent in all sensors. Note the strong salinity front and the numerous small-scale interleaving features.
|
|
|
 |
|
|
Figure 4. A curtain plot of the difference between optical absorption at 676 nm and 650 nm during the first Jabuka radiator in the region of the Mid-Adriatic Filament. This difference is correlated with chlorophyll concentration. Most obvious is the subsurface maximum present throughout the region at 75 meters depth. Significant horizontal patchiness also exist in this layer. At the northern rim of the Pit, the chlorophyll maximum becomes diffuse and reorganizes north of the rim.
|
|
|
 |
|
|
Figure 5. A curtain plot of optical attenuation at 650 nm in the Po River plume. The viewing perspective is looking from the Italian toward Istria, Croatia. At the surface there is a thin layer of high attenuation indicative of high levels of suspended particulate material. This layer thins, narrows and decreases in attenuation progressing offshore. Also, in the first leg near the center of the leg, particles can be seen beneath the surface layer, apparently falling from the surface.
|
|
|
 |
|
|
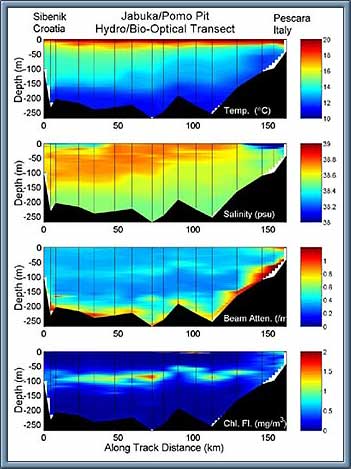
Figure 6. The hydrographic section showing temperature, salinity, beam attenuation and chlorophyll fluorescence extending from near the Croatian town of Sibenik westward toward the Italian town of Pescara. As in Figure 4, the subsurface chlorophyll maximum is pronounced. The influence of the Po River plume can be seen in the low salinity, high chlorophyll near surface band near the Italian coast.
|
|
|
|
|
Dolce Vita 1—Cruise Report
—filed by Dr. Craig Lee on 14 February 2003
The science party includes teams of physical, optical, biological, and chemical oceanographers and two meteorologists. Our science objectives require that we efficiently
locate target fronts and filaments and that we time our measurements to coincide with strong Bora events [wind jets with spatial scales of O(10 km)]. Toward this end we are accompanied by
a synoptic meteorologist from the Austrian Air Force who provides highly detailed daily forecasts based, in part, on data generously provided by the Croatian Meteorological Service.
Additionally, the ocean optics team from the NRL-SSC Ocean Color Group operates an on-board satellite receiving station, generating real-time SST and ocean color images. We monitor this
information along with results from our in situ measurements, adjusting our sampling strategy as conditions evolve.
Cloud cover limited the value of satellite remote sensing for the period immediately preceding our departure. To compensate for the lack of broad scale context, we chose to occupy a set of
sections spanning the northern and central basins (north of the Jabuka Pit). R/V Knorr sailed from Ancona, Italy, at 16:00 on 31 January 2003 into a strong, developing Bora that
brought 4-5-m seas shortly after leaving the harbor. Although we had hoped for a strong forcing event, the first one began a little too early causing the science party to ramp up under
demanding conditions.
Several of the sections reoccupy lines historically sampled by investigators from IRPEM-Ancona, with additional lines sampling from the Po delta to Perec and traversing the mid-basin
southward to the Jabuka Pit. We executed these sections using our Trisoarus towed profiling vehicle and, in some locations, the Bio-Optical Profiling package (BOP). Chemists and biologists
from IRPEM, the University of Zagreb, and USC analyzed regularly spaced surface samples for pigment and nutrient concentrations and phytoplankton throughout this initial survey.
 |
|
|
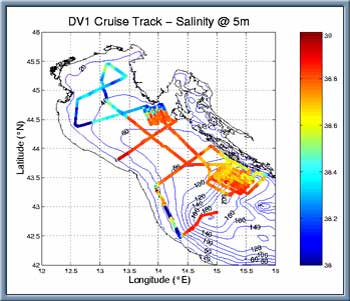
| The Dolce Vita 1 cruise track (as of 13 February 2003) colored by salinity at 5 m. Intensive girds mark the Jabuka pit (southern) and Istria
(northern) surveys. The remaining lines comprise the broad-scale survey occupied at the beginning of the cruise.
|
|
|
The sections revealed typical wintertime conditions, with little or no vertical stratification (except along the Italian coast) in the shallow northern basin. Farther south, profiles
sampled deep mixed layers with Levantine intermediate and northern Adriatic deep waters below. Interesting features included:
A filament of Po River water that extends off the Italian shelf south of Ancona
A plume of Po River water that covered a large portion of the northern basin, probably advected off the shelf during a recent Bora
A prominent, compensated front south of Istria
The mid-Adriatic filament, formed where the East Adriatic Current (EAC) turns eastward, leaving the Croatian coast and following the northern flank of the Jabuka pit.
The along-basin section revealed two distinct dense water pools and provided evidence supporting the idea that northern Adriatic deep waters form along the Croatian coast, perhaps south of
the Istrian peninsula.
By the end of the initial survey, winds had shifted to Sirocco, blowing from the southeast. We chose to conduct intensive surveys of the mid-Adriatic filament during this period, sampling
its eastern side, where it leaves the Croatian coast. A combination of an intensive cross-filament grid pattern, a series of sections radiating from the coast positioned north and south of
the feature, drifters and a hydrographic/optics section are all used to investigate the dynamics governing the separation and to quantify the portion of the EAC that turns westward to
follow the bathymetry. Preliminary examination indicates that most of the EAC turns to follow the northern flank of the Jabuka pit, bounded by what appears to be a strong, anti-cyclonic
circulation lying to the north. One surprise is the observation of energetic small scale (< 10 km) variability, which is thought to be common during the stratified summer period but absent
during the winter.
A forecast calling for a moderate/strong Bora sent us north to sample the front south of the Istrian peninsula. The feature lies beneath a strong, narrow wind jet, in a region of
hypothesized wintertime deep water formation. We arrived at the survey site on the afternoon of 11 February, immediately deploying a bottom-moored 5-beam ADCP, followed by an array of
13 drifters (including optical, mini-met and thermistor chain equipped units) spread across the upstream end of the Trisoarus sampling pattern. Two 16-hour Trisoarus surveys followed,
sampling the front through the Bora's peak. During these surveys, we found a strong, vertically-oriented, density-compensated temperature-salinity front. The front was typically less
than 1 km wide and marked by a band of water denser than that found to either side. We believe that this is evidence of cabbelling, where nonlinearities in the equation of state can lead
to the production of mixed water masses that are denser than the water masses from which they originated. The second survey captured dense waters spreading across the bottom, while a third
survey (currently under way) occupied during a period of weaker winds, reveals pronounced tilting of the (formerly vertical) frontal interface.
Another strong Bora, forecast to begin on 16 February, offers an ideal opportunity to sample the plume of Po River water that extends into the northern basin. Following a fourth occupation
of the Istrian survey, we plan to relocate our resources to focus on this feature. The winter Dolce Vita cruise will conclude with a reoccupation of the section running lengthwise down the
basin, designed to investigate changes wrought by the passing of three significant Bora events.
 |
|
|
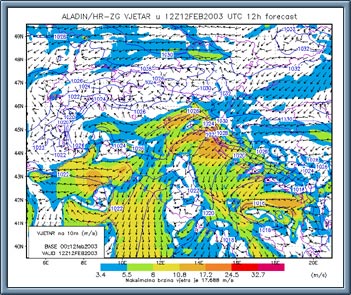
| A sample forecast chart (Croatian Meteorological Service) depicting the strong Bora that coincided with the Istria intensive survey. Winds channeled
through the mountain ranges along the Croatian coast produce narrow, intense jets over the Adriatic. These forecasts, along with remotely sensed SST and ocean color,
provide critical tools that allow us to successfully target specific features and events.
|
|
|
|
|
 |
|
|
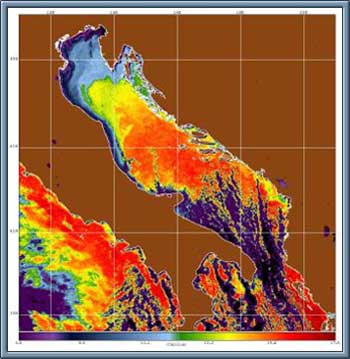
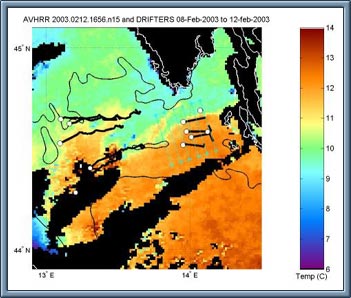
| AVHRR sea surface temperature image from 7 February 2003. Note the prominent front stretching from the southern tip of Istria across the basin and
the filaments extending off the Italian coast.
|
|
|
 |
|
|
| SeaWiFS chlorophyll image from 7 February 2003. A plume of Po River water extends from the river's inflow, across the basin to the Croatian coast.
This feature is not apparent in the corresponding AVHRR image. The Istrian front, obvious in SST, has only a weak color signature. Filaments extending across the Italian
shelf from the West Adriatic Current, are visible in both fields. The mid-Adriatic filament has neither SST nor ocean color signature.
|
|
|
 |
|
|
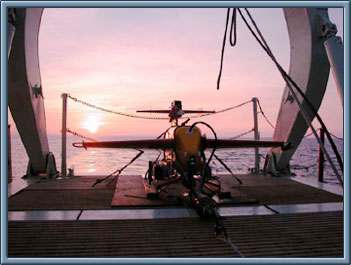
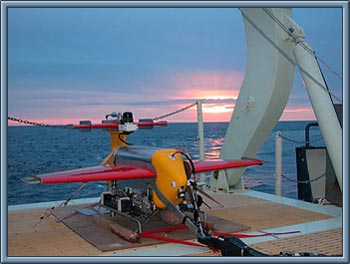
| Sunset over the Adriatic aboard the R/V Knorr with the APL-UW Trisoarus towed profiling vehicle in the foreground.
|
|
|
 |
|
|
| Jason Gobat, Tim McGinnis, Eric Boget, Marlene Jeffries (APL-UW), bosun Pete Liarikos, and Billy Eident (R/V Knorr) prepare for a nighttime
Trisoarus deployment.
|
|
|
 |
|
|
| Velocities at 18 m, taken from the first occupation of the Jabuka Pit survey. The survey captures the Mid-Adriatic Filament as it turns offshore,
and suggests that little of the East Adriatic Current continues past the Jabuka pit to flow northward along the Croatian coast. Although the data contain a modest tidal
component (~5 cm/s), energetic variability at scales of O(10 km) is clearly present.
|
|
|
 |
|
|
| Sea surface temperature at the Istrian front. Green lines mark the first occupation of the Trisoarus survey, while black lines trace drifter paths
(circles mark the end positions). The strong Bora winds that channel through this region are hypothesized to drive North Adriatic deep water formation.
|
|
|
|
|
 |
|
|
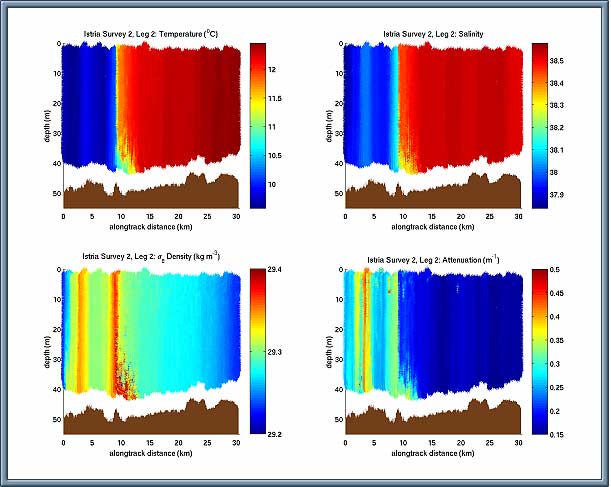
| Temperature (UL), salinity (UR), density (LL), and light transmission (LR) for a section (north to south) across the Istrian front. The section was
occupied during a period of strong wind forcing. There is little density contrast across the nearly vertical, compensated temperature-salinity front (cold/fresh to the
north, warm/saline to the south). A narrow band of anomalously dense water sits at the frontal interface, widening as it approaches the bottom.
|
|
|
|
|

