
|
|
Overview |
|||||||||||||||||||
|
Vertical and lateral water properties and density structure within the Arctic Ocean are intimately related to the ocean circulation, and have profound consequences for sea ice growth and retreat as well as for propagation of acoustic energy at all scales.
|
|||||||||||||||||||
|
Objectives |
|
SODA focuses on understanding how the upper Beaufort Sea responds to changes in inflow and surface forcing. Specific science questions address three oceanographic properties: buoyancy, momentum, and heat. |
|
Buoyancy |
Momentum |
Heat |
||
|
What are the causes and consequences of the changing upper ocean stratification (mixed layer and Pacific Water)? Vertical: What is the interplay among wind entrainment, convection, solar heating, and buoyancy input?
Lateral: What is the importance of heterogeneity in mesoscale and submesocale processes?
|
How is the wind stress partitioned within the ice–ocean system (depth and frequency; surface waves; ice motions; mixed layer and deeper acceleration; internal waves)?
|
What is the fate and impact of the significant increase in upper ocean heat (and the associated sound channel)? What processes control the near surface temperature maximum formation and release?
How difficult is it for the mixed layer to entrain and access heat carried in the Pacific Water, and how does it vary with sea ice conditions? |
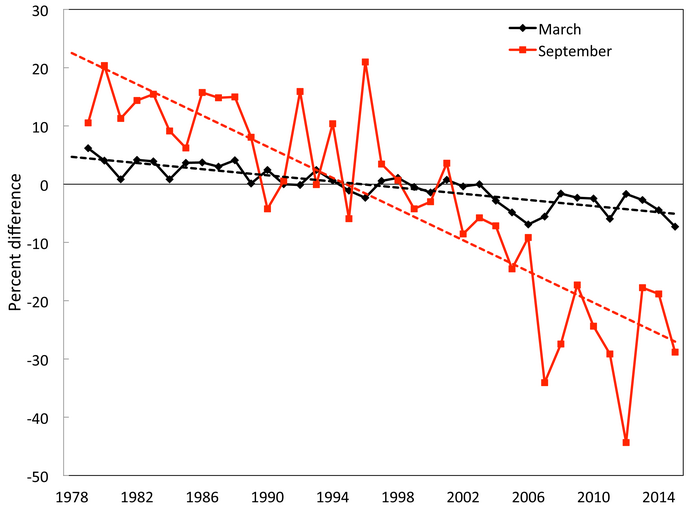
Time series of Northern Hemisphere sea ice extent anomalies in March (the month of maximum ice extent) and September (the month of minimum ice extent). The anomaly value for each year is the difference (in %) in ice extent relative to the mean values for the period 1981–2010. The black and red dashed lines are least squares linear regression lines. The slopes of these lines indicate ice losses of –2.6% and –13.4% per decade in March and September, respectively. Both trends are significant at the 99% confidence level. From Perovich et al. (2015). |
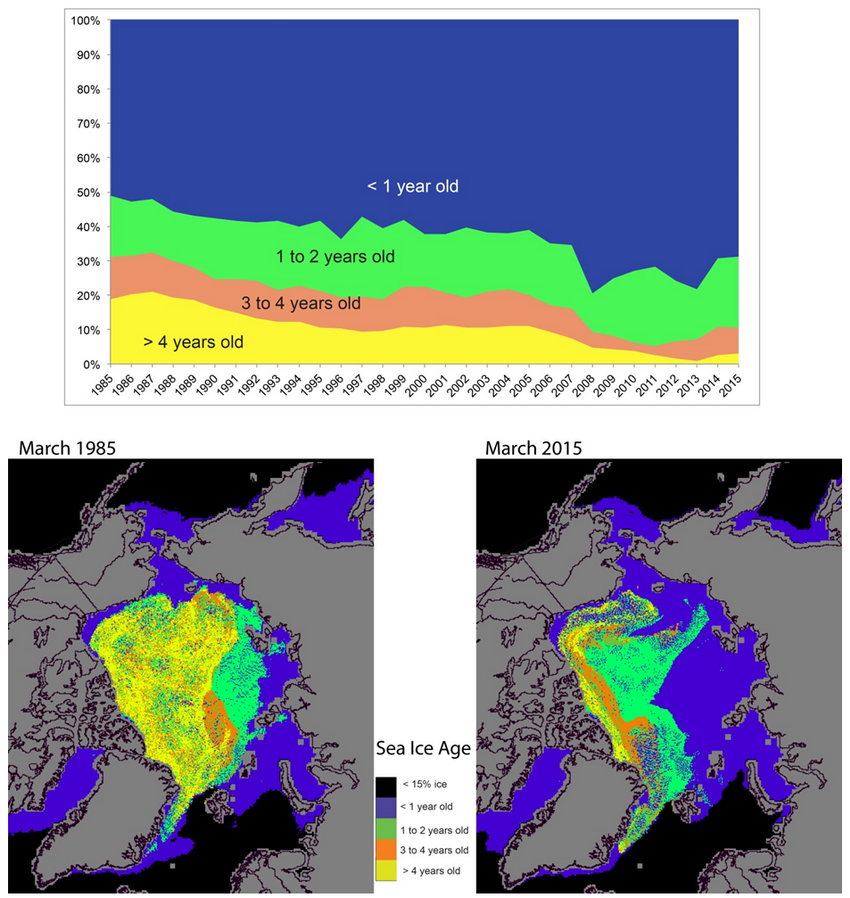
A time series of sea ice age in March from 1985 to the present (top) and maps of sea ice age in March 1985 (lower left) and March 2015 (lower right). From Perovich et al. (2015). |
|
21 September 2018 |
|
Jennifer MacKinnon, aboard the Sikuliaq We wrapped up our second module a few days ago, which revolved around what we believe was a warm coastal current that separated possibly around Barrow and headed into the main basin. We first spied this feature in an image from NIC, and then followed that up with a few targeted acquisition high-resolution SAR 'strip chart' images from CSTARS. [As an aside, I cannot stress enough the incredible value of these images for quick adaptive sampling decision making. I've never been on a cruise with such a productive integration. It's going to be hard to ever come back without them now!]. In those images (Figure 1) you can see what looks like a mushroom-shaped feature, almost like a bomb explosion but in plan view, as outlined in the ice, centered at 150°W, 72°N. We were fascinated by these images and thought they were suggestive of a warm current, which geographically could be the Alaskan Coastal Current or some derivative thereof, that tried to round Pt. Barrow, had too much inertia, separated, carried forward offshore, and then plowed full speed into this big remnant ice conglomeration that's been hanging around this area all summer. Per usual adaptive sampling, it took us a little while to put that image together with the story we could figure out by poking holes in the ocean in situ in various ways. We started by doing a series of Fast CTD sections across and along the feature and discovered that it was, in its core, a 100-m tall wall of 7° water (Figures 2 and 3). Current speeds in the center were around 1 m/s (Figure 4), which makes it an impressive freight train of heat headed for the ice pack. Numerous SWIFT and wire-walker drifting assets were deployed and recovered several times in it, and we spent several days alternating microstructure and Fast CTD suveys. |
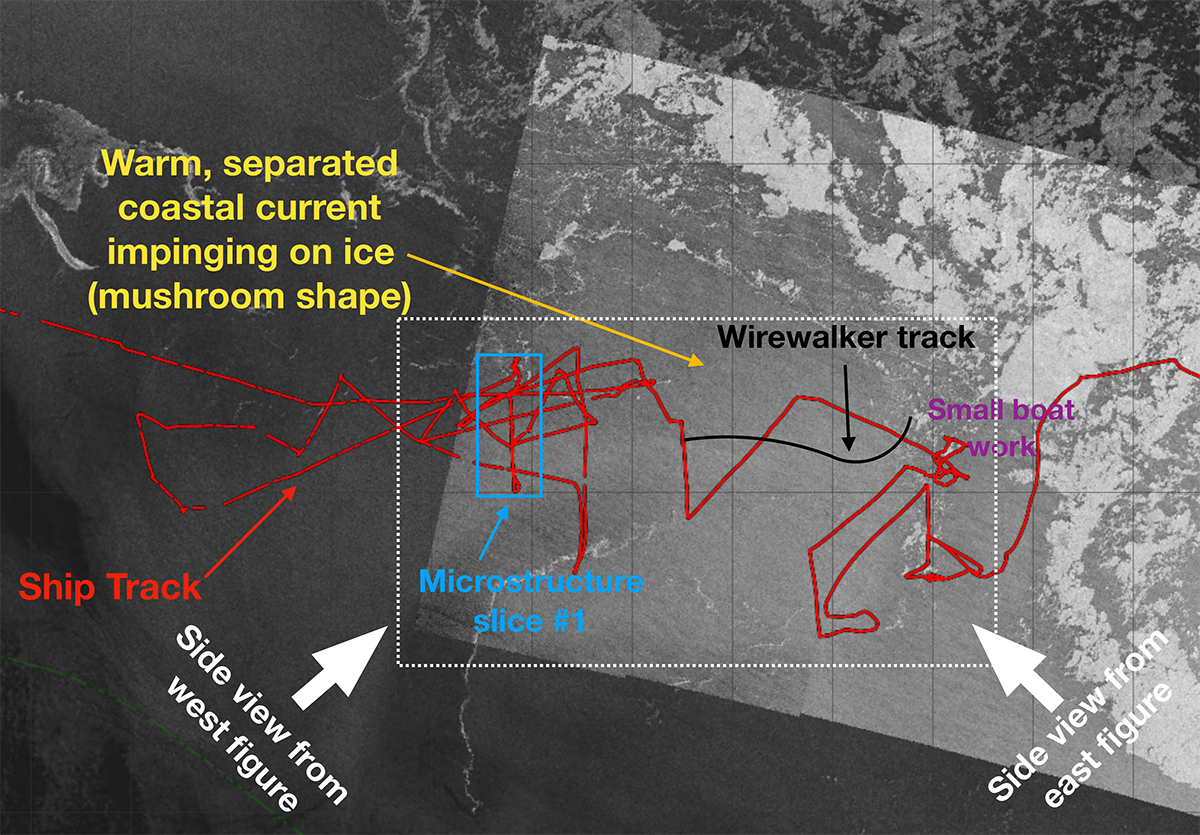
FIGURE 1. Overview SAR images from NIC (outer scale) and CSTARS (inner scale) of the feature we were tracking. The 'side view from west', 'side view from east' and 'microstructure section' arrows go with the contents in Figures 2–4, respectively. 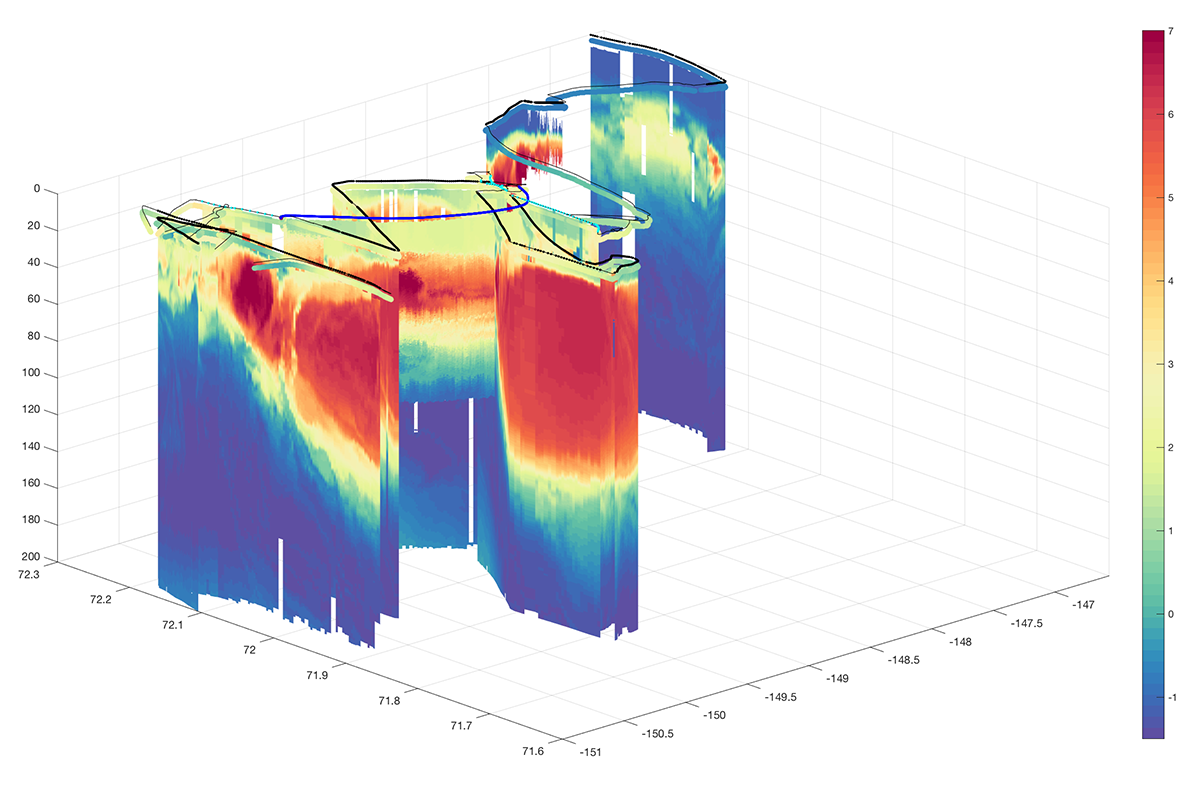
FIGURE 2. Sub-surface view of temperature data through the warm current, looking from the west towards the east. This includes data from the Fast CTD, Microstructure profiler, and the drifting profiling wire-walker. 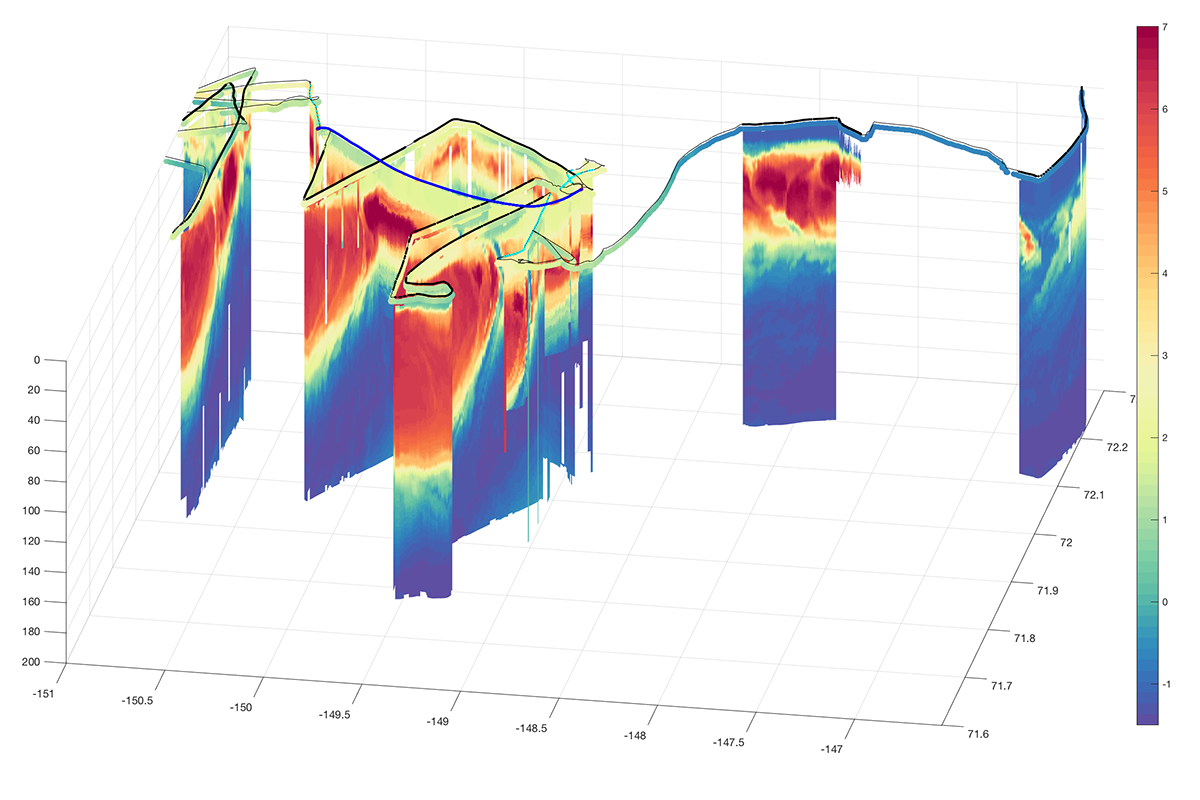
FIGURE 3. Same as Figure 2, but now the perspective is from the east. |
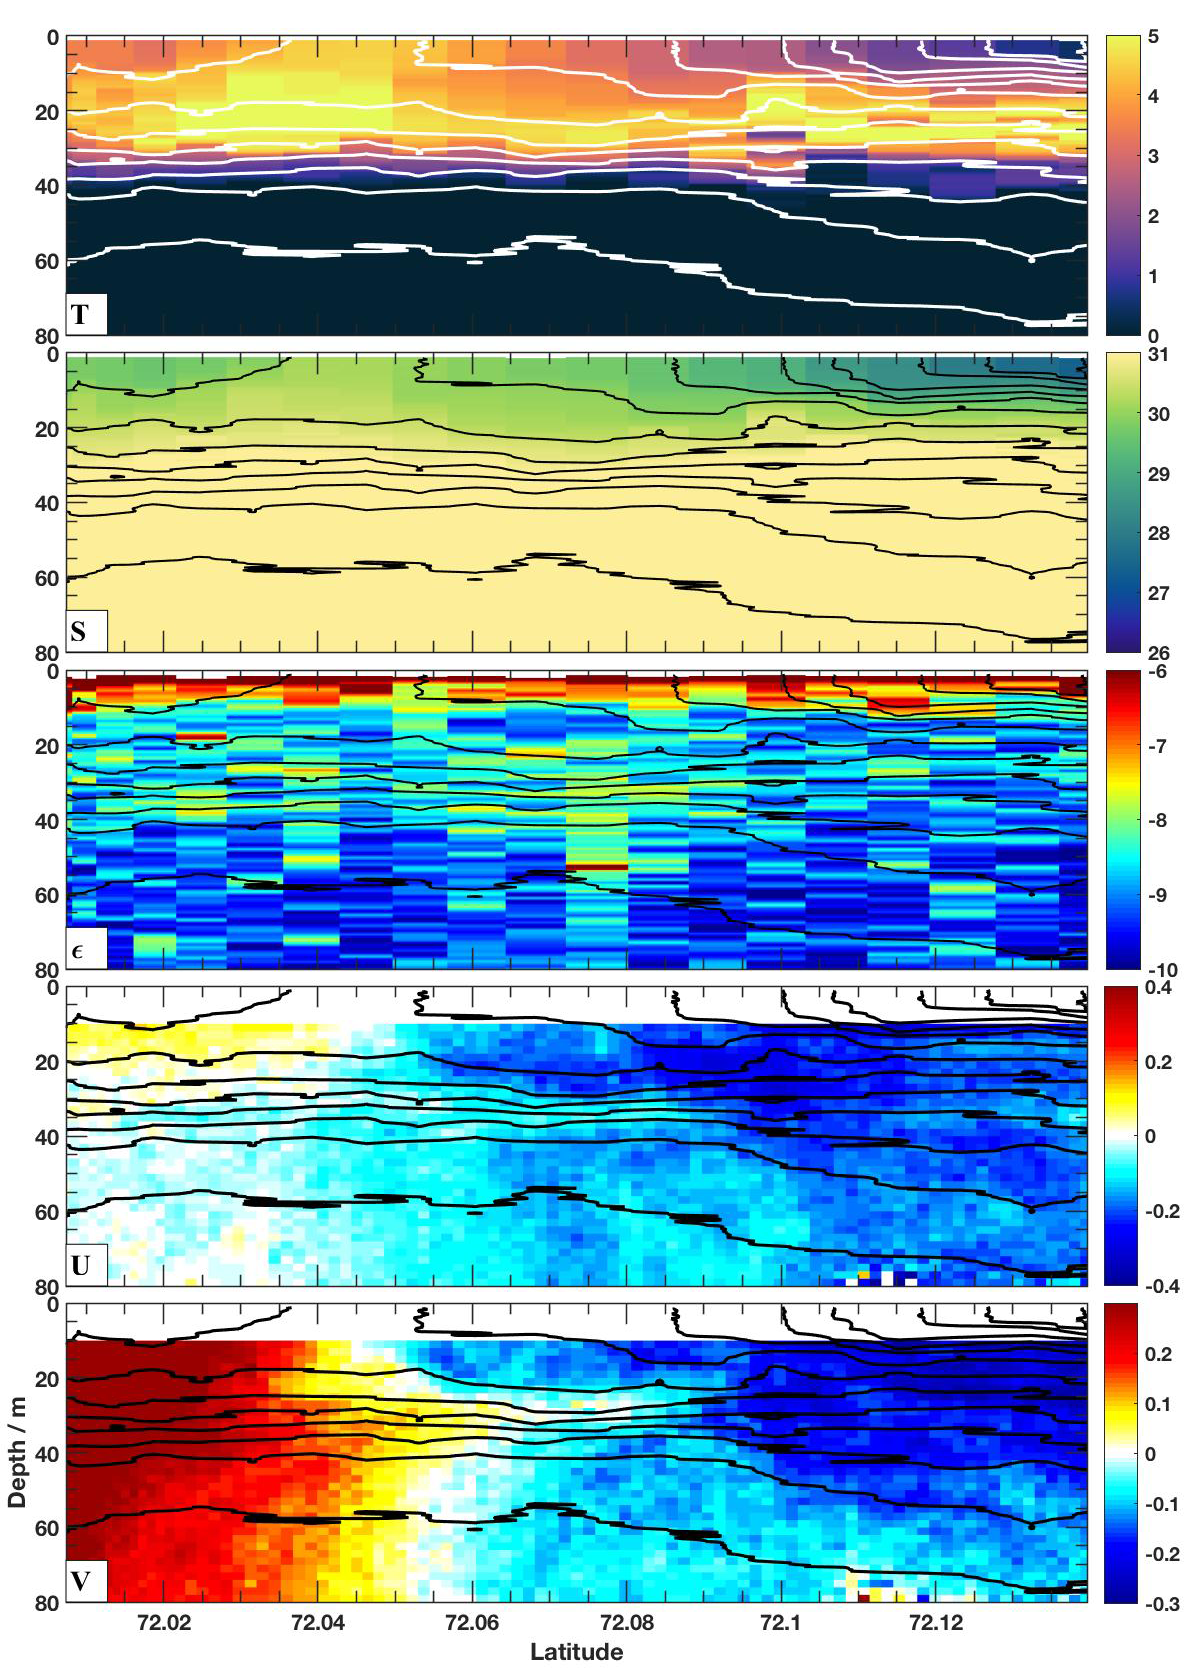
FIGURE 4. A high-resolution microstructure cross-section (at the location indicated with the blue box in Figure 1). Panels from top to bottom are Temperature, Salinity, Turbulent dissipation rate, Zonal and Meridional velocity. |
|
In the main part of the current, sloping isopycnals aligned well with strong vertical shear, suggesting a large-ish scale (~20 mile wide) geostrophically balanced current (though Rossby numbers are not small). At points this water extended all the way to the surface, but for most of it there was a fresher surface layer skidding on top, picking up heat from below at rates we tried to quantify with microstructure. One interesting by-product of that surface layer is that the throughflow TSG temperature and salinity are *not* good measures of this feature (Figure 5). |
|
At the leading (eastern) side of the mushroom, this warm current appeared to encounter a different water mass flowing modestly to the northwest (perhaps the main gyre circulation). At this collision/confluence point our eastward flowing warm jet bifurcated, with the northern part curling off to the north, and the southern part curling off to the south. The 100-m tall wire-walker, released up-stream, rocketed west with the current and took the northern route, providing us an excellent Lagrangian point to follow. At the confluence point there was evidence of a variety of smaller scale eddying structures that were stirring some of this (dense) warm water up, and swirling it sideways and downward along isopycnals, wrapping up like taffy made of spice. There was a strong boundary of loose ice demarcating the water mass confluence spot, just as was visible in the SAR images. A small flotilla of SWIFT drifters and some CTD sampling conducted from the Sikuliaq work boat conducted near this junction helped see the complex very near-surface story of one water mass partly sliding under another. |
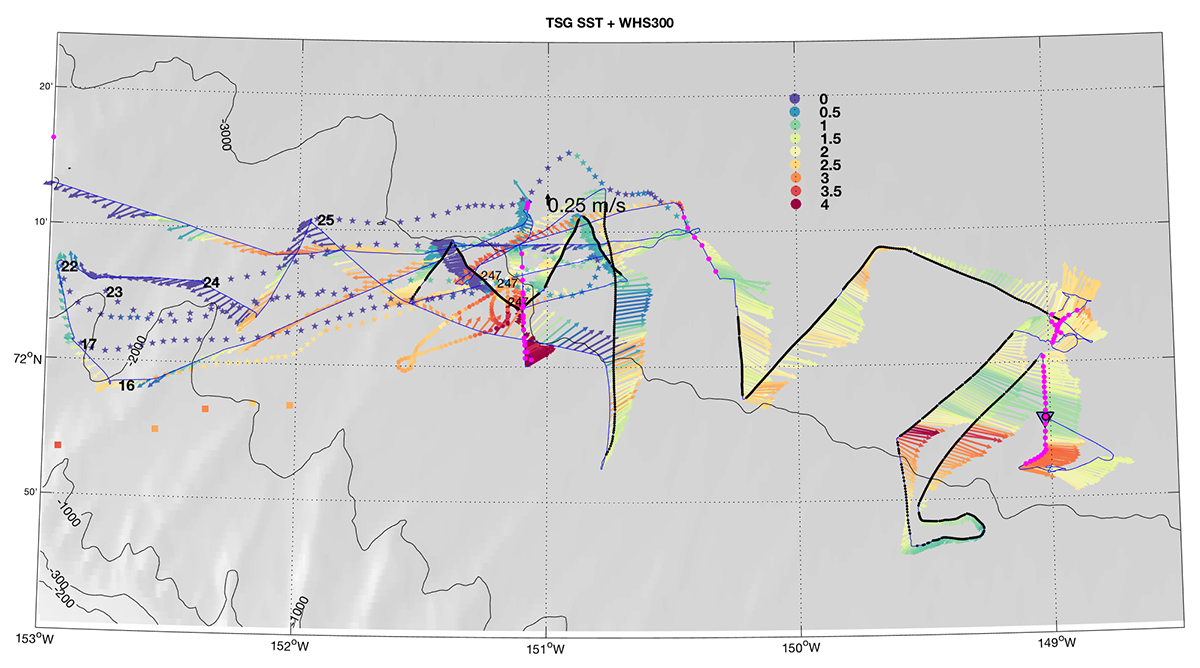
FIGURE 5. Plan view map of near-surface temperature from the ship and multiple SWIFT drifters (color), with near-surface currents (arrows). The longest arrows are order 1 m/s. |
|
|
|
17 September 2018 |
||
|
Jennifer MacKinnon, aboard the Sikuliaq 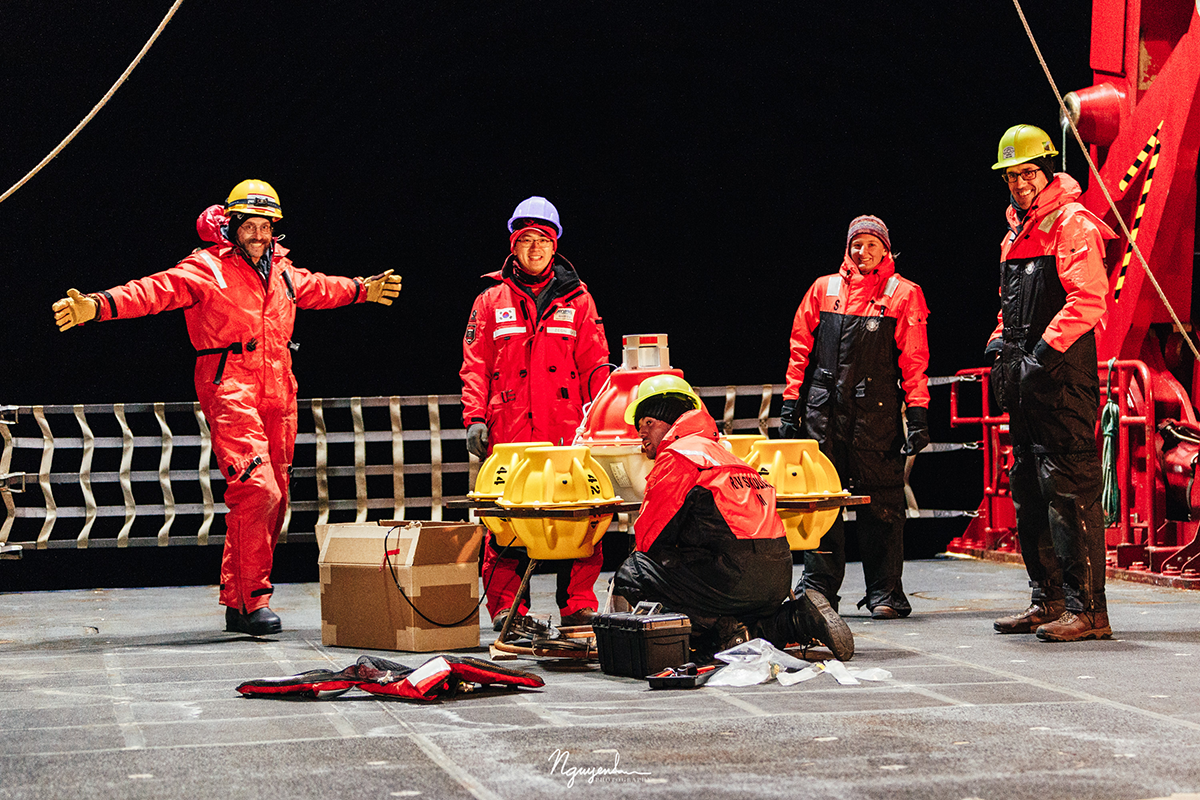
A group on deck prepares PIES instruments for deployment. 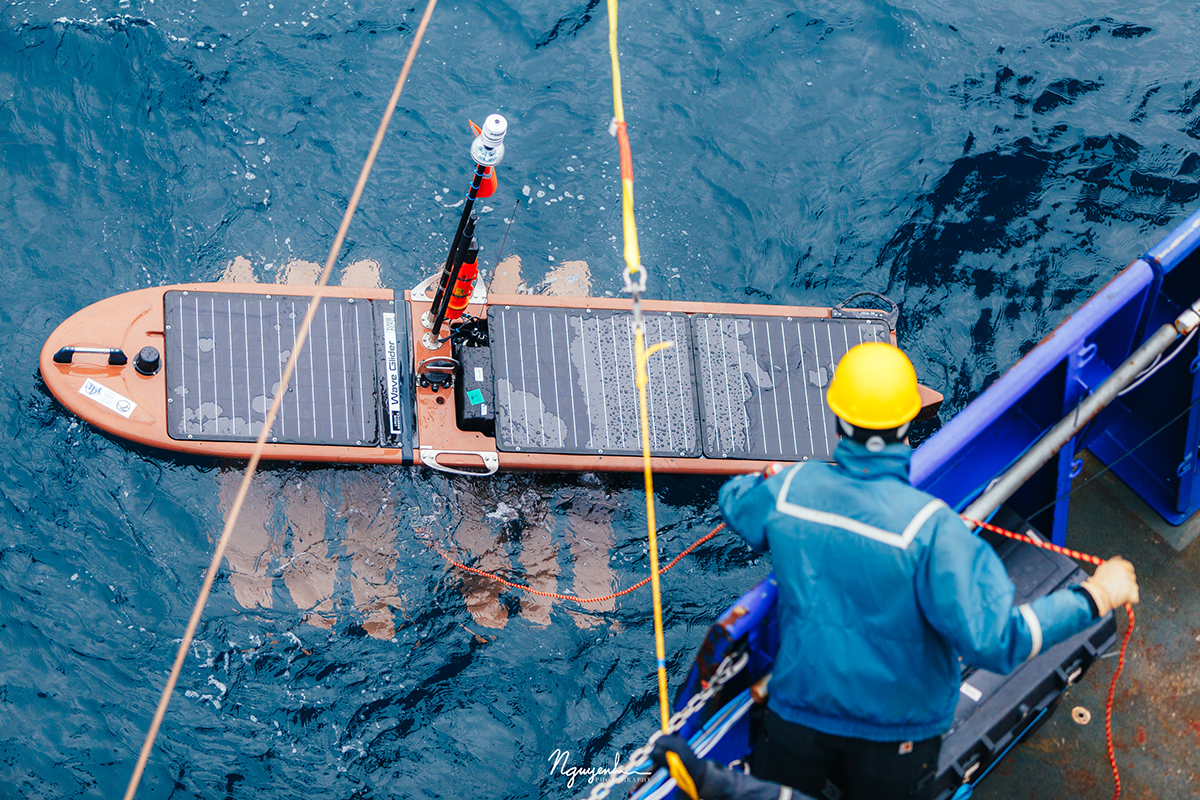
Jim Thomson deploys a Wave Glider. 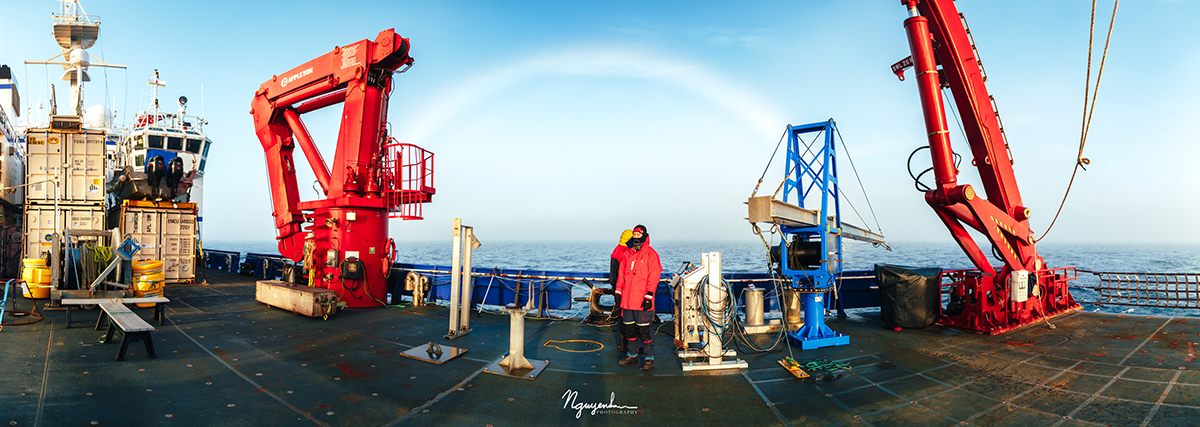
Bundled up watch-standers profile the Fast CTD framed by a 'fog-bow'. |
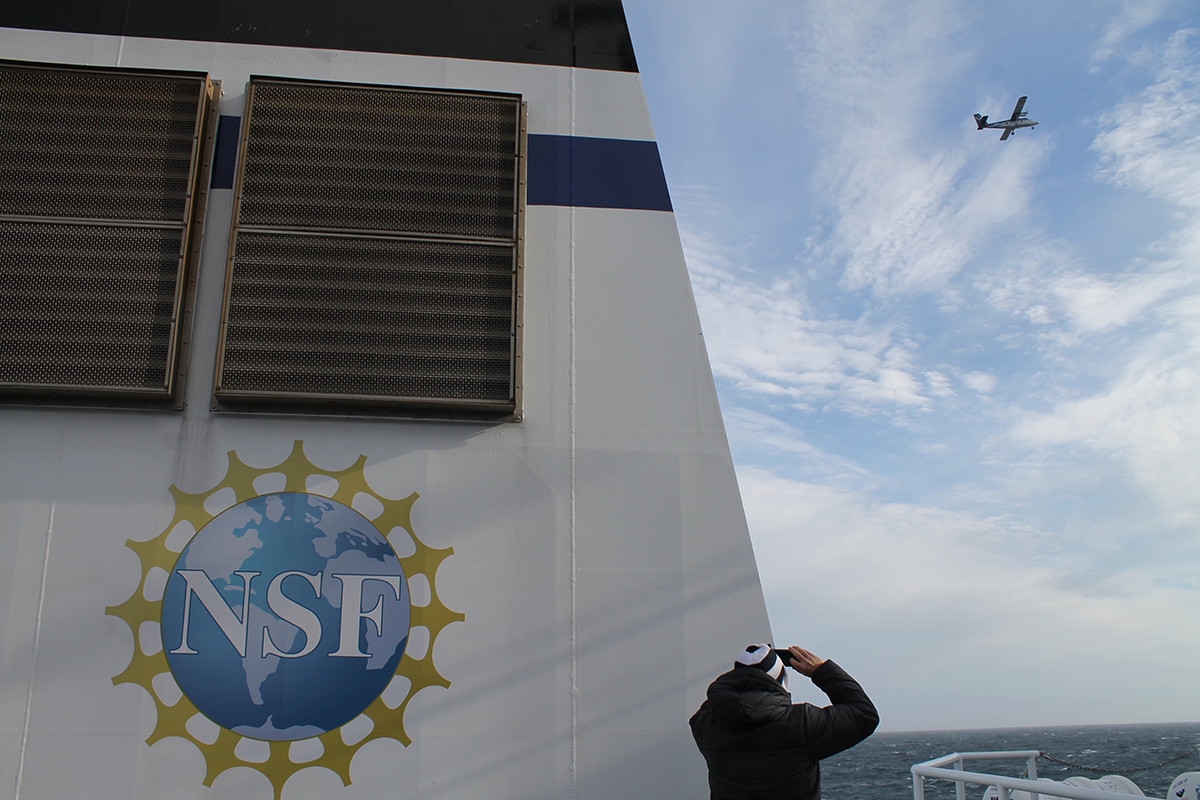
Inter-agency coordination at its best: NOAA Twin Otter airplane conducting areal sampling, in support of an ONR-funded cruise, on an NSF-owned ship. 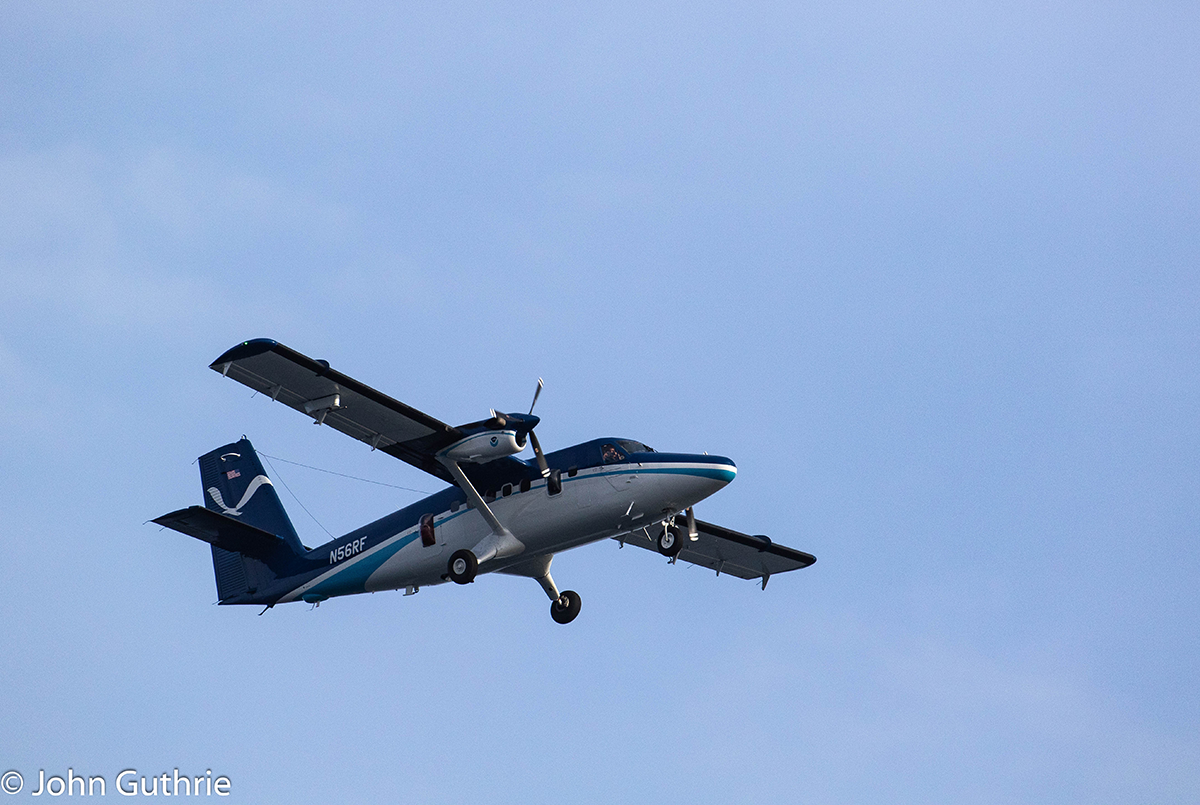
Close up of the NOAA Twin Otter. 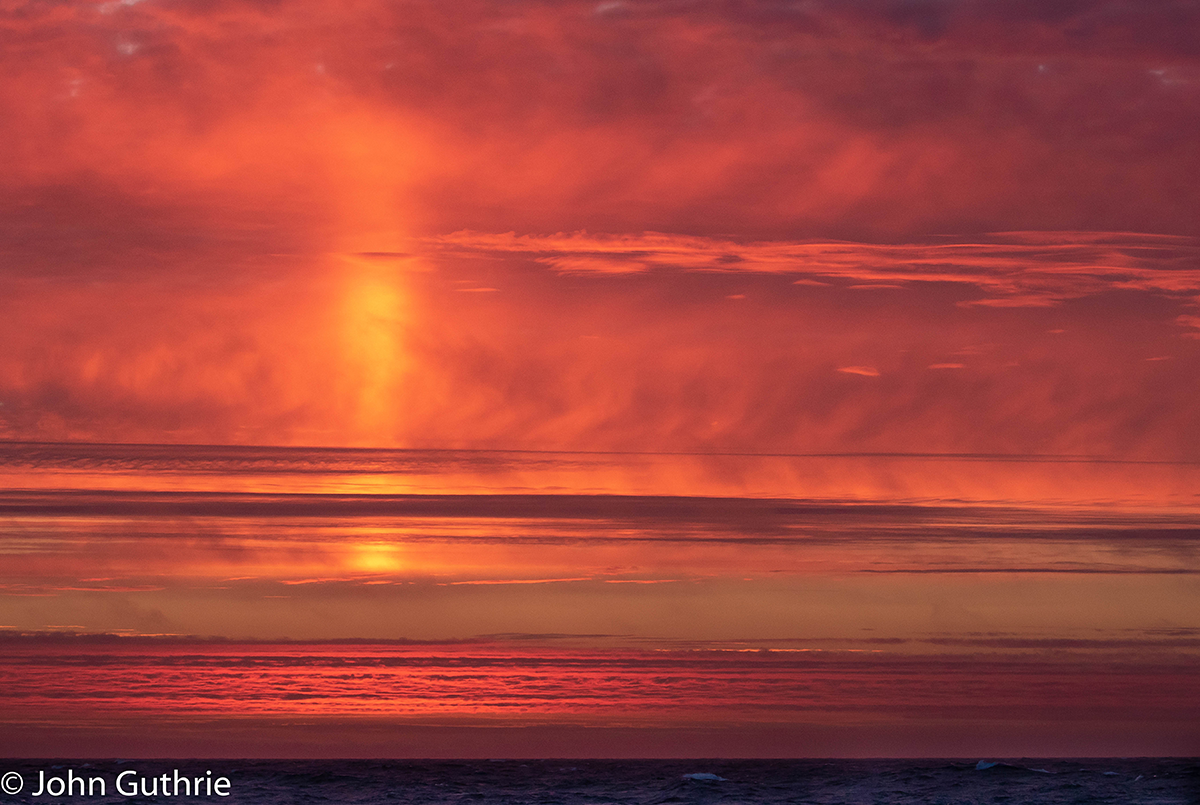
Arctic sunrise. |
|
|
|
16 September 2018 |
|
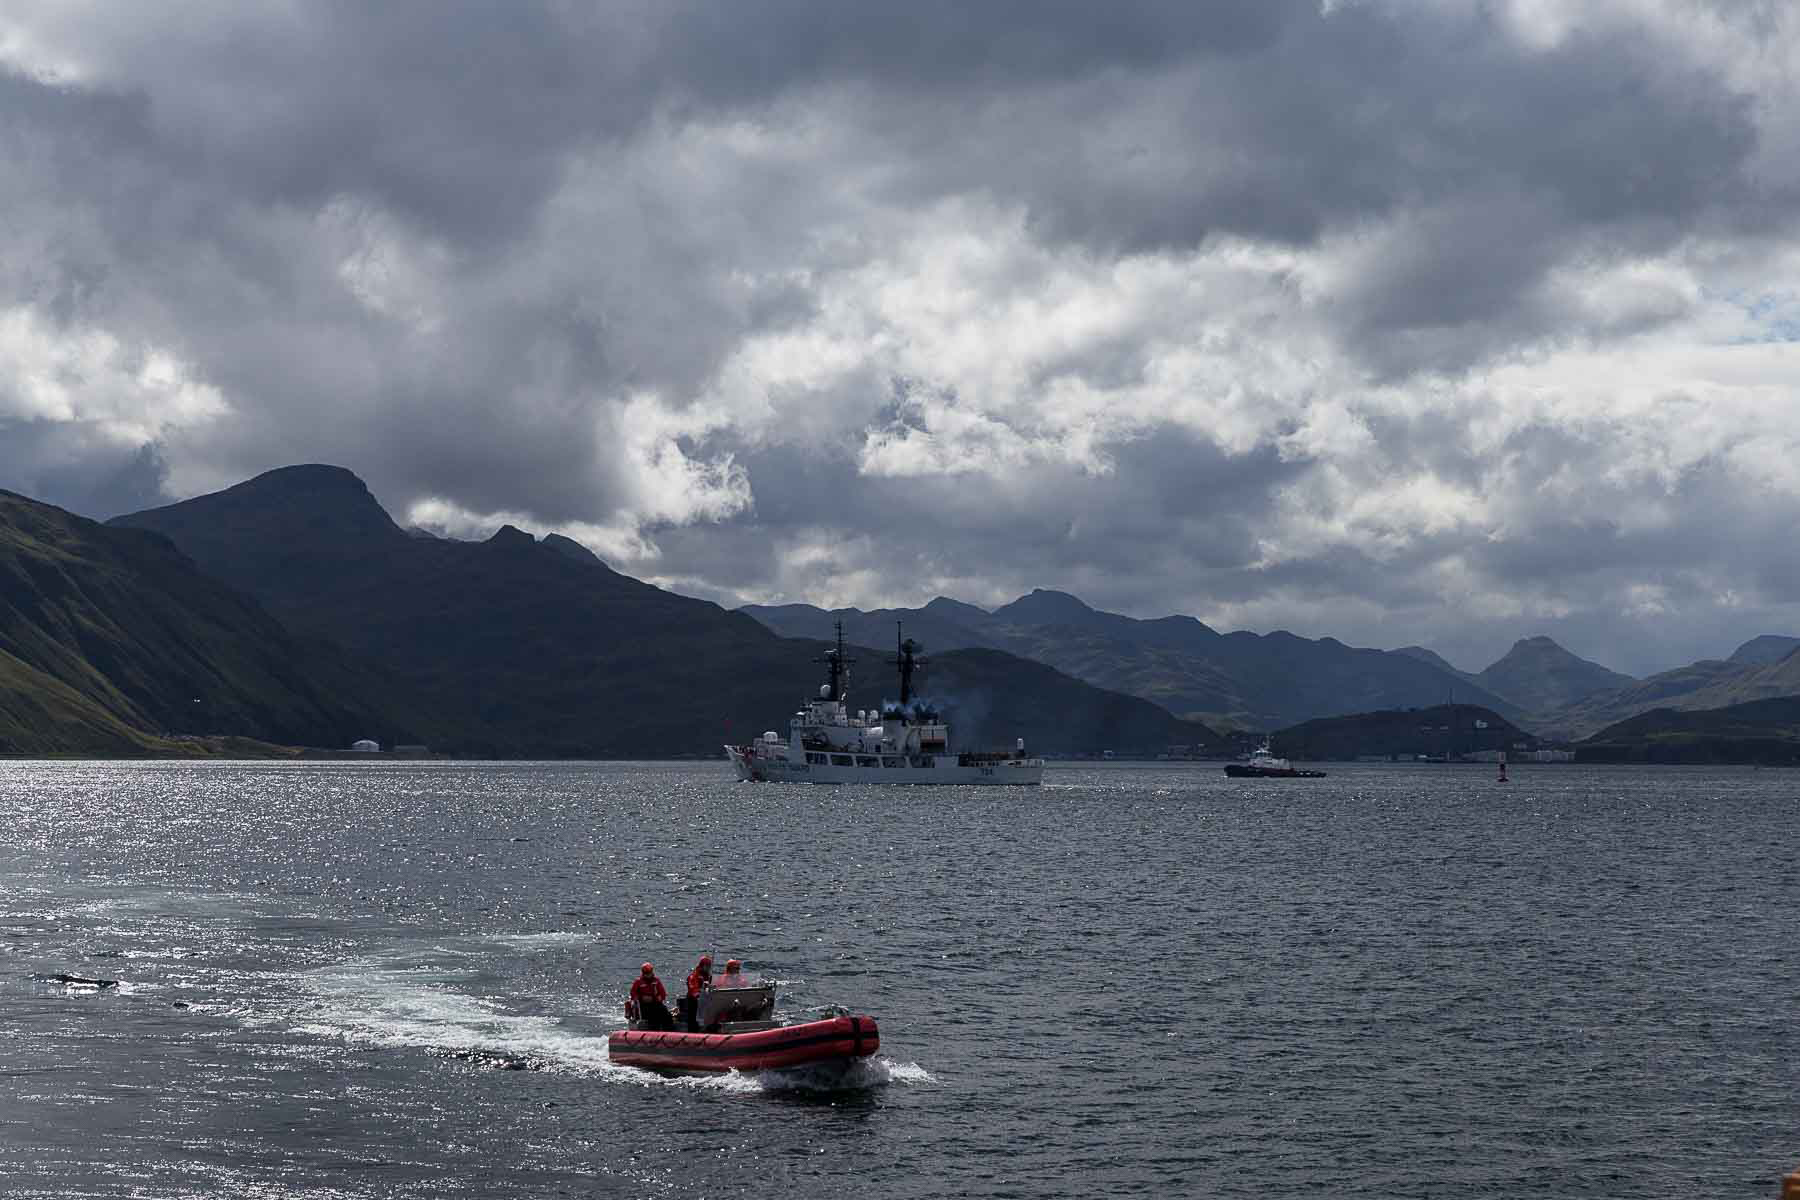
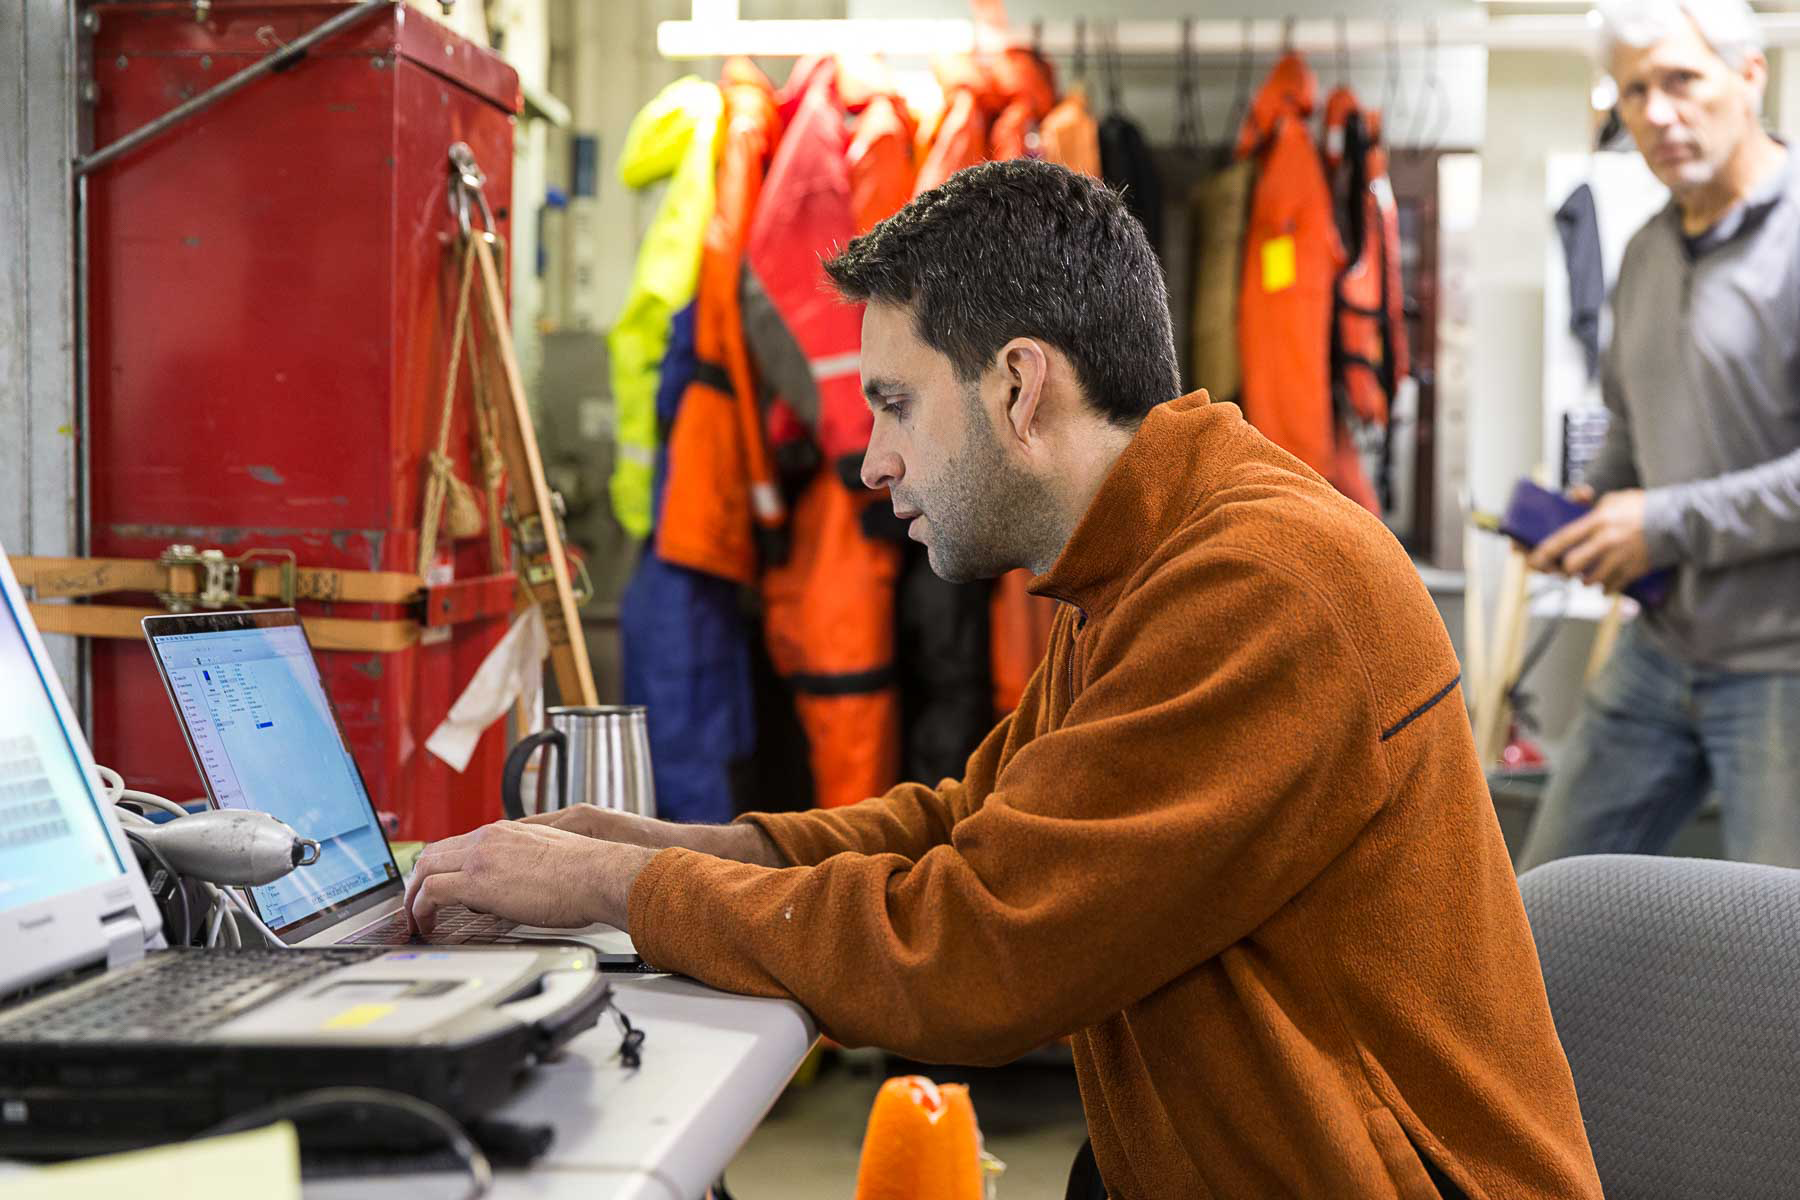
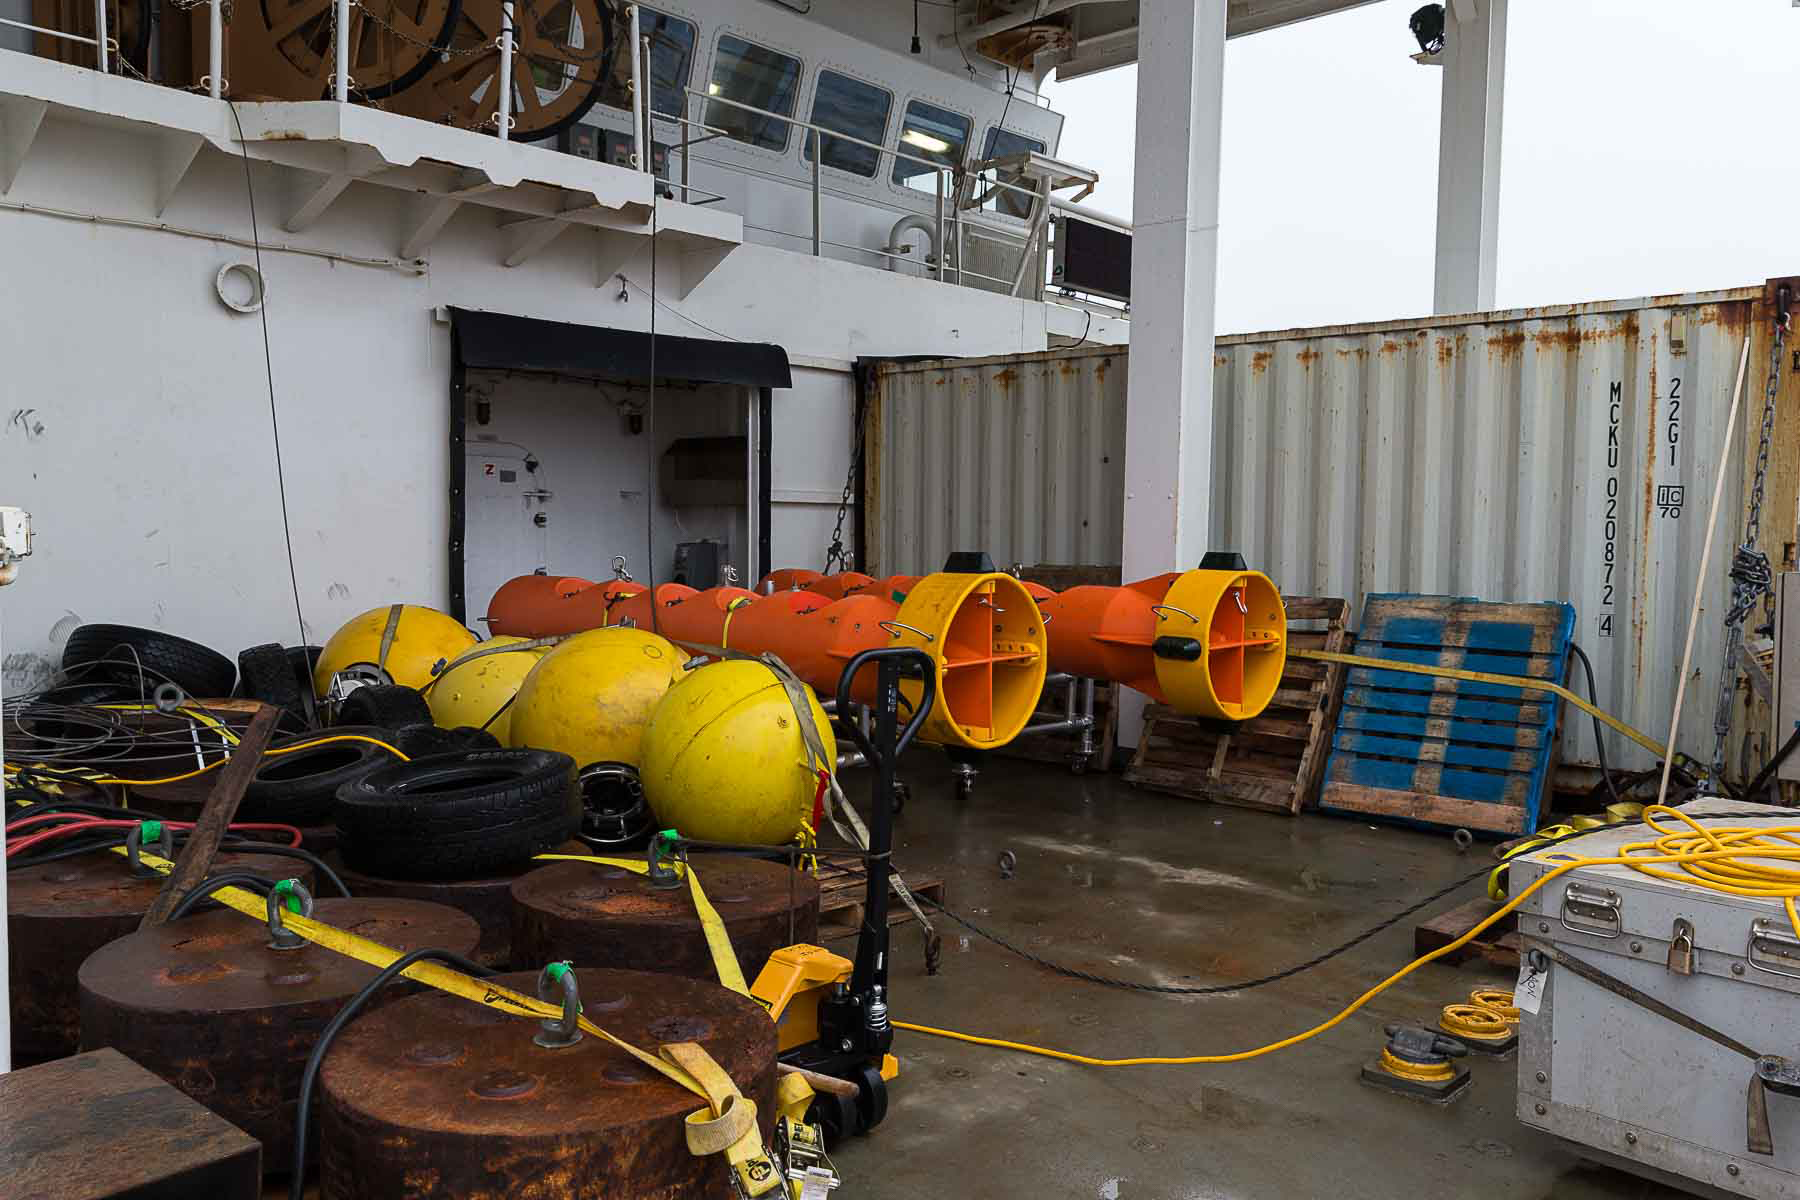
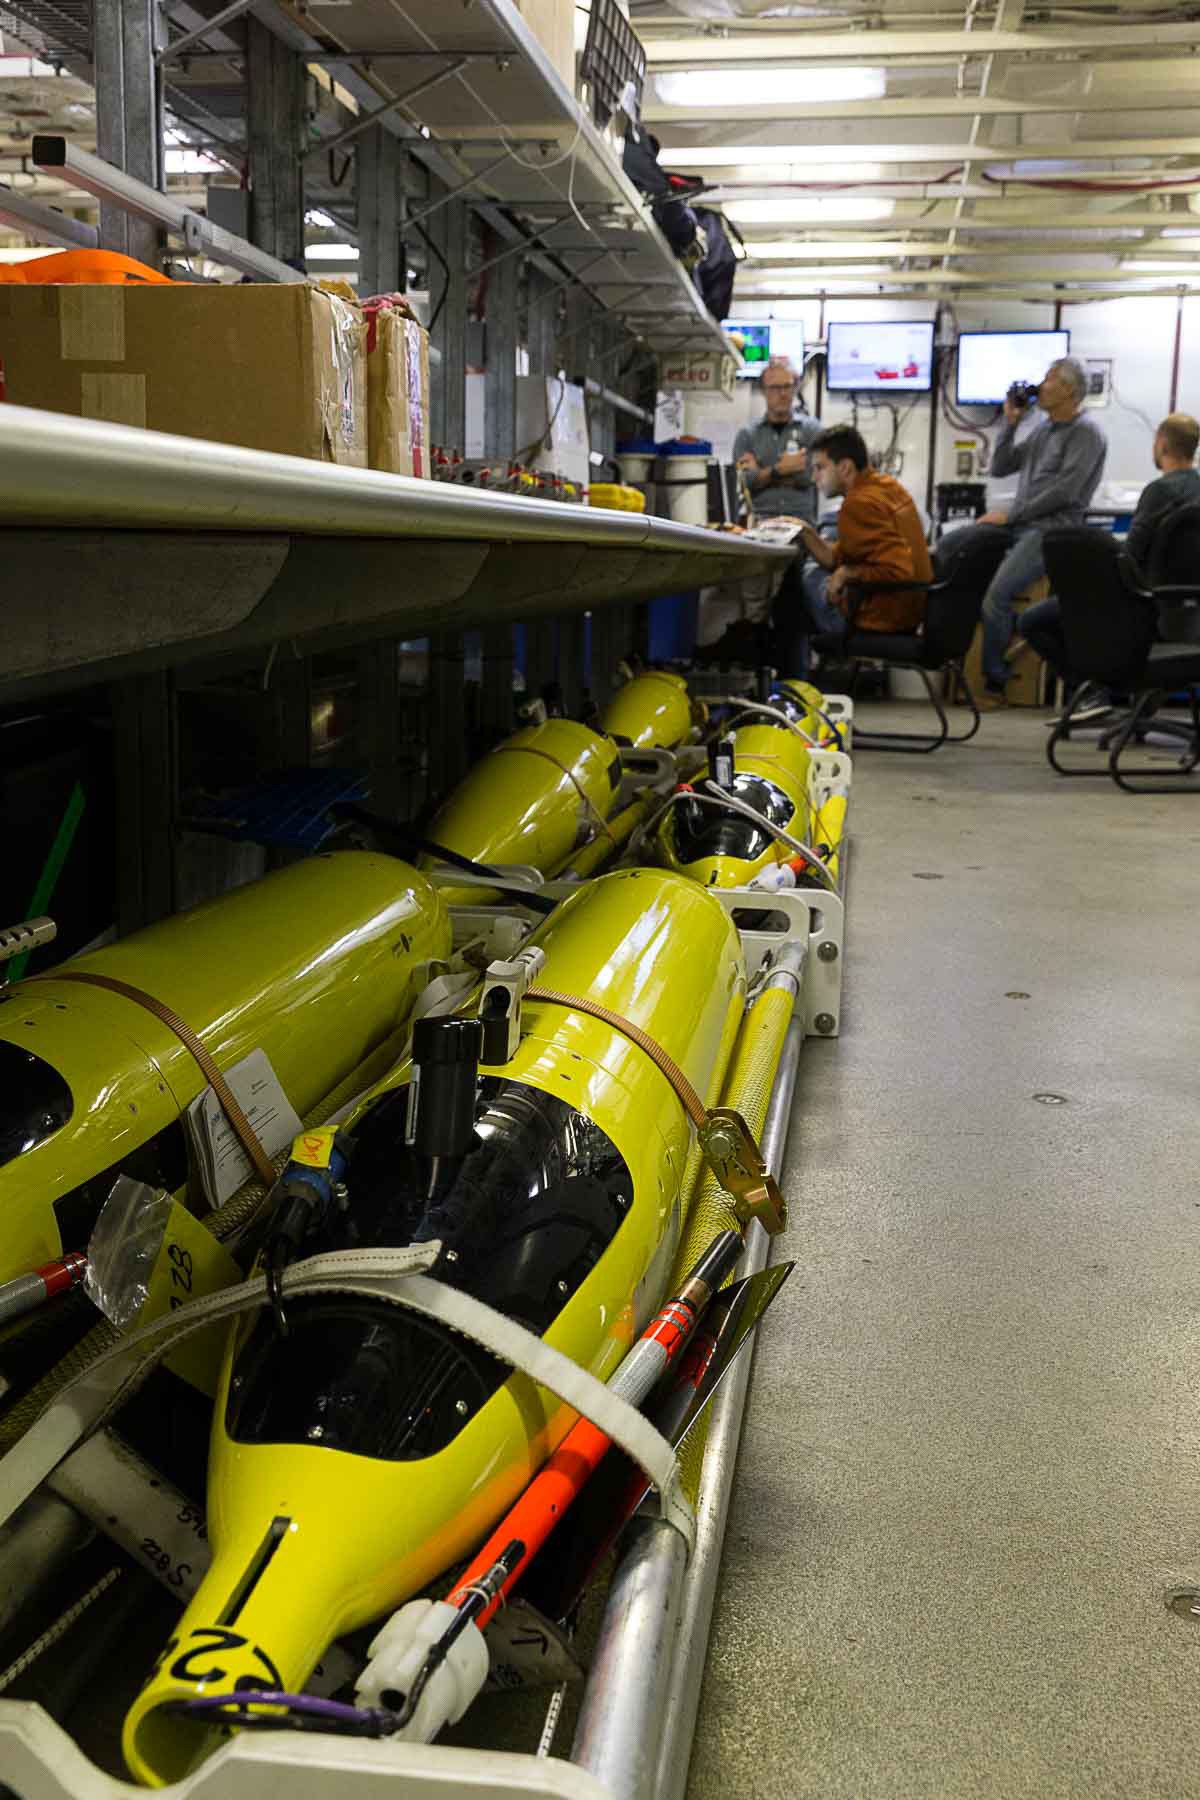
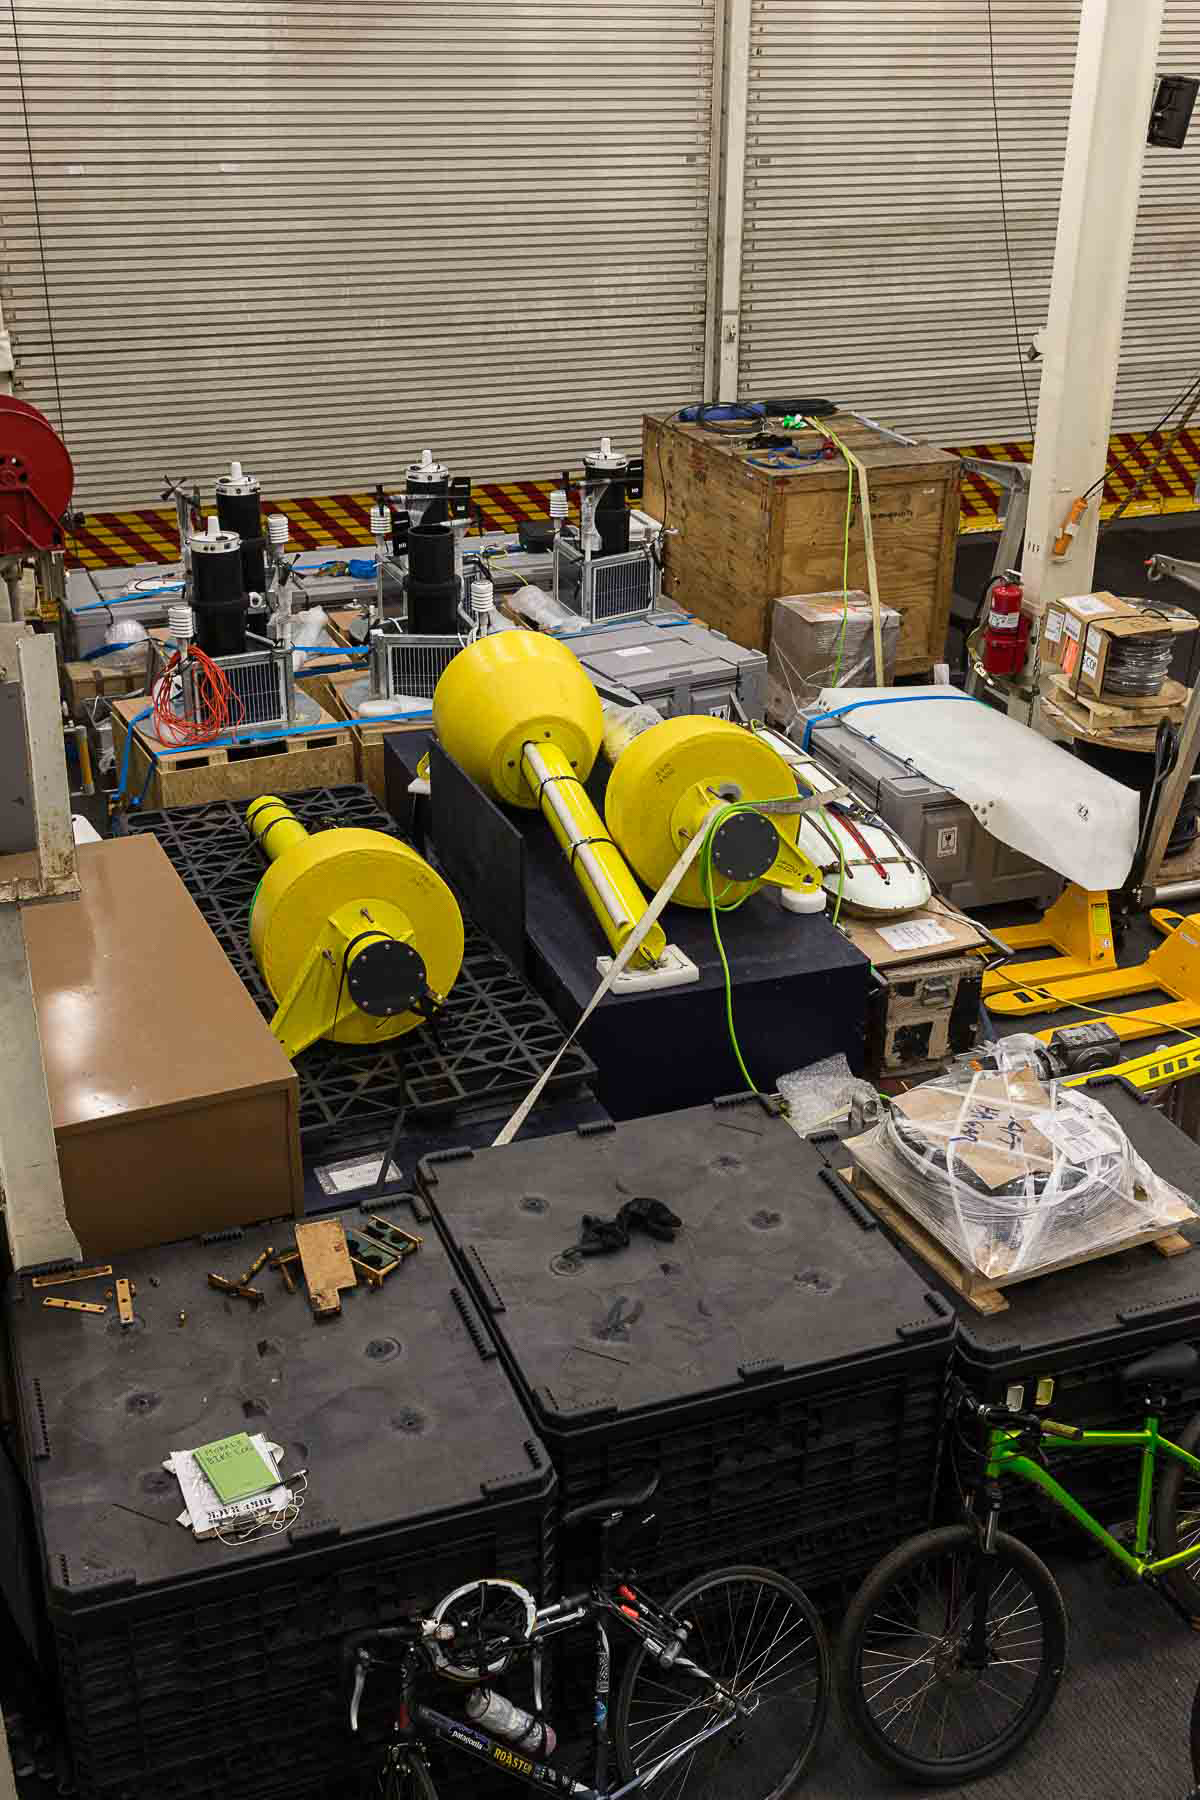
Craig Lee aboard the Healy After a hectic few days of loadout, we sailed from Nome on 14 September to calm seas and sunny skies. Great views of Dutch Harbor leaving port, and a tail wind pushing us along, accelerating our progress toward the Arctic. Aboard we have an international collection of research teams, supported by the excellent US Coast Guard team aboard the icebreaker Healy. The first couple of days were spent simply loading, sorting, and setting up the diverse collection of instruments we'll be using to study the atmosphere, sea ice, and upper ocean. These include the long, torpedo-shaped floats that will sit at the top of our deep-water moorings, carrying instruments to measure swaths of ice draft and profiles of water velocity, the small, buoyancy-driven autonomous Seagliders and SGX gliders that will sample around the moorings for the coming year, and the collection of instruments that will be deployed onto the ice, to drift with the floes through the coming winter and spring, collecting measurements of the atmosphere, snow and sea ice, and upper ocean. Healy is large — far larger than the research vessels that our team is accustomed to working from. The sea ice team has been given half of the helicopter hanger to build their instruments — enough space for them to put together all of the buoys in parallel. There's a second high-bay where we'll build out some of the larger components for the moorings. Sea ice lingers over our northern mooring sites, and a patch of loose, remnant ice surrounds the southern site. Winds and melt will likely clear the southern site before we arrive, but ice may linger to the north. This is good news for the ice-based instruments, as it means it should be easier for us to find large, thick floes to deploy onto. We're about to anchor offshore of Nome, for a brief stop to pick up some equipment. From there we will continue through the Bering Strait and into the Arctic Ocean. |
|
|
|
13 September 2018 |
|
Jennifer MacKinnon, aboard the Sikuliaq We've spent the last week, the first full one of the SODA process cruise, surveying near the Chukchi shelf break. This area marks an important boundary between warmer, saltier water flowing in from the Pacific through Bering Strait, and the cooler, fresher surface waters of the Arctic. We know from previous observations that some of this warmer but much saltier (and hence denser) Pacific water subducts beneath the fresh Arctic surface, and swirls around the basin as blobs and filaments of heat, heat that if mixed upwards could potentially melt a significant amount of sea ice. Recent work by some of our colleagues (Timmermans et al., Science Advances, 29 Aug) shows that this sub-surface lurking heat content has been increasing dramatically in the last few decades, a feature of the "new Arctic". The rate at which it's mixing upwards may also be changing. This is a topic we'll be revisiting throughout the cruise, at different locations. Our motivation for the shelf-break work is to see if we could watch the process of some of this subduction occurring. We know that a substantial amount of subduction happens in Barrow Canyon, but there is also evidence of some happening further west, all along the shelf-break through Ekman and frontal processes. Figure 1 shows an overview of our study region on the shelf break. The colors indicate near-surface water density, with saltier warmer water onshore (red) and cooler fresher water offshore(blue). The arrows indicate near-surface currents. Along the continental slope, there's a strong current going to the northwest. Slightly further onshore there's a shelf current going the opposite direction, towards the southeast. Data going into this plot comes from the ship, Solo floats, SWIFT drifters, and Wave Gliders. Along the shelf-break there is a strong front between water masses. Upon closer look (not shown) this is actually a series of many smaller front-lets, some of which may be related to near-surface small-scale eddying features, some of the same eddying features that instigate subduction. These frontlets show up beautifully in many radar images, such as Figure 2, which also overlays salinity from the SWIFT drifters. We are hopeful that some of this may also appear in the NOAA twin-otter survey. |
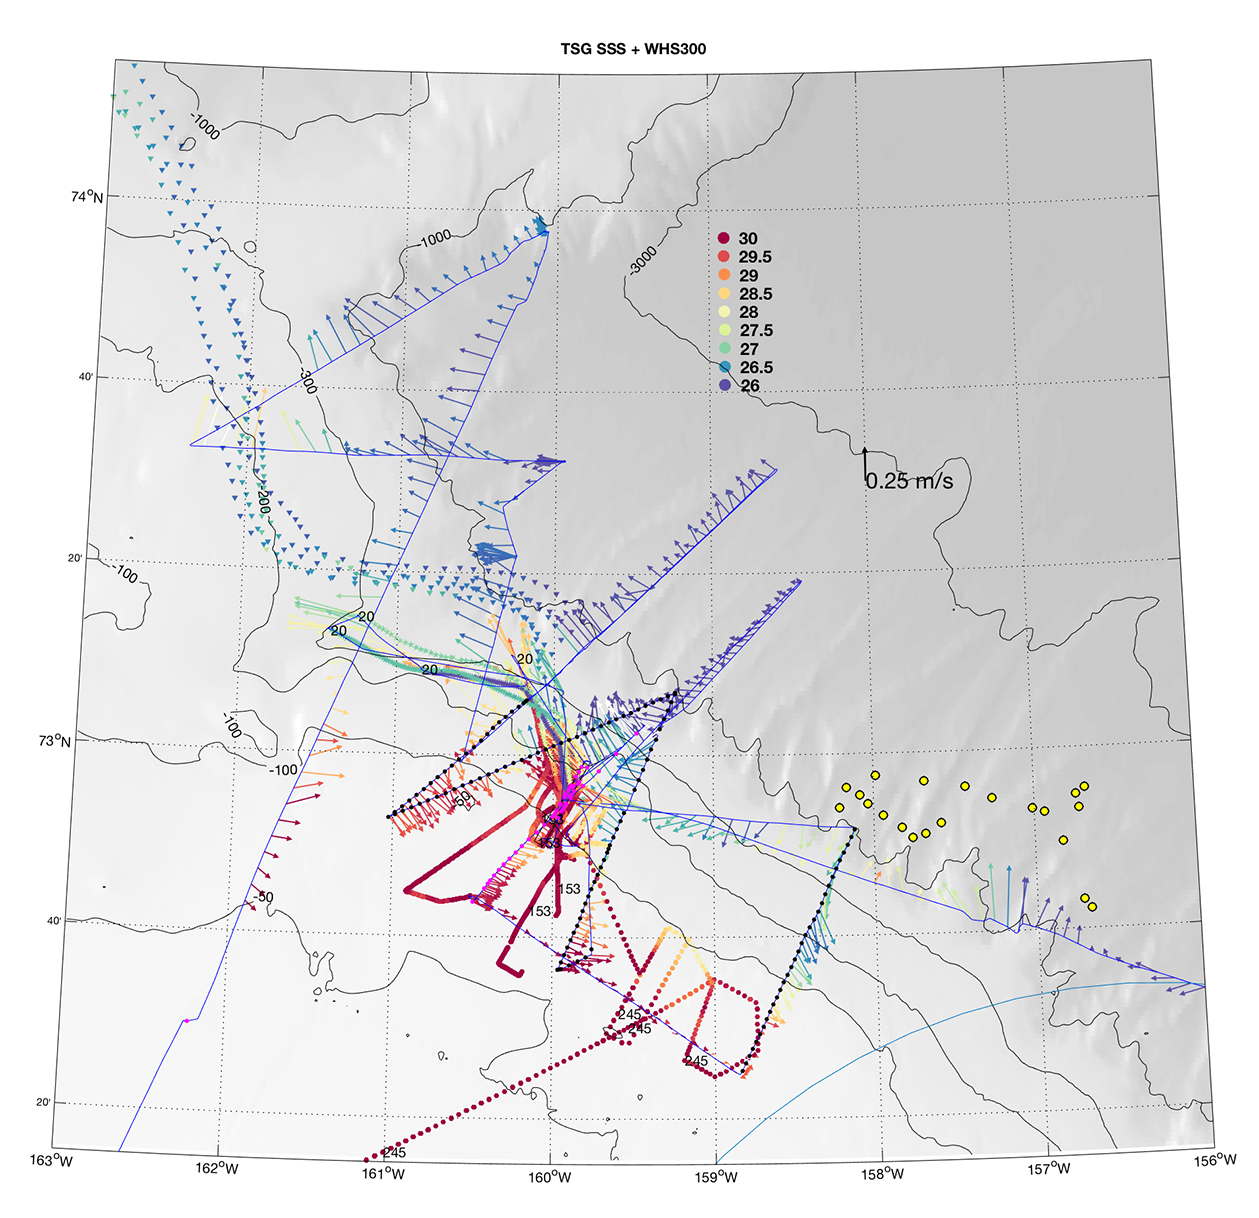
FIGURE 1 |
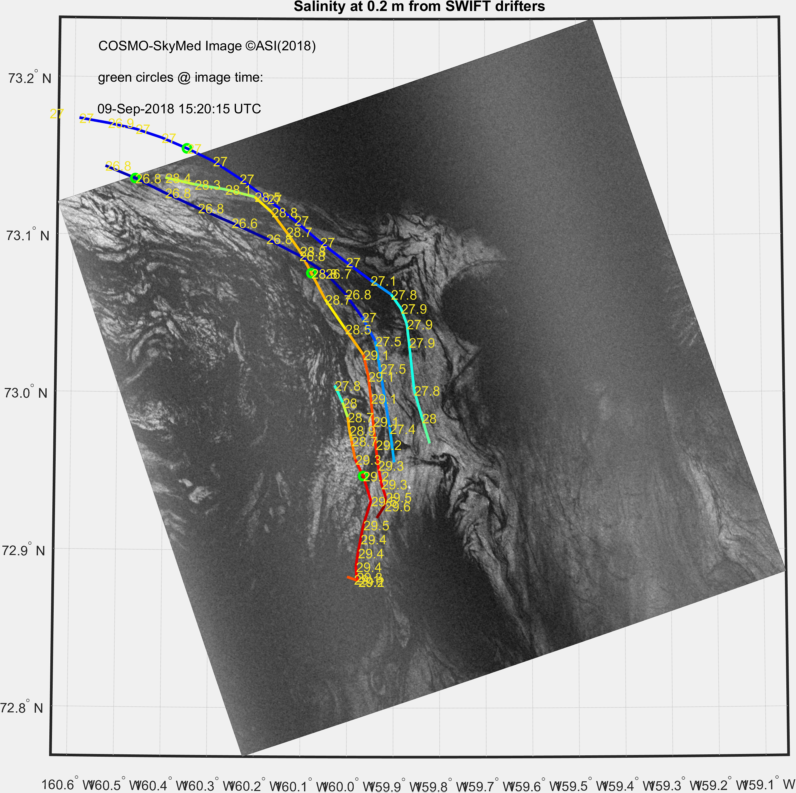
FIGURE 2 |
|
One of the interesting physical processes that can happen just before water subducts (or not), is that this is its last chance to be modified by fluxes to or from the atmosphere. Such fluxes may significantly alter its water properties. This we knew, and underway analysis of the specialized instrumentation mounted on the ship for this cruise is meant to assess that. What came as more of a surprise to some of us (especially those of us who do *not* think about the atmosphere often) is that a sea-surface-temperature front can have a dramatic effect on the atmosphere. Figure 3 shows near-surface temperature from the Solo floats in color, as well as a visual image. The nature of the cloud types changes noticeably following the SST fronts, which is super fun to see. Sub-surface, the picture becomes even more complicated. Figure 4 shows temperature from one of our zig-zagging Fast CTD surveys. On the shelf, the water has a clear two-layer structure. At the shelf-break and offshore, there is a dramatic band of warmer (and saltier) water *sub-surface*. We suspect some of this is water that has come from Barrow Canyon and is flowing westward in the slope current, while some of it is locally subducting through frontal processes. Will be very fun to de-tangle! |
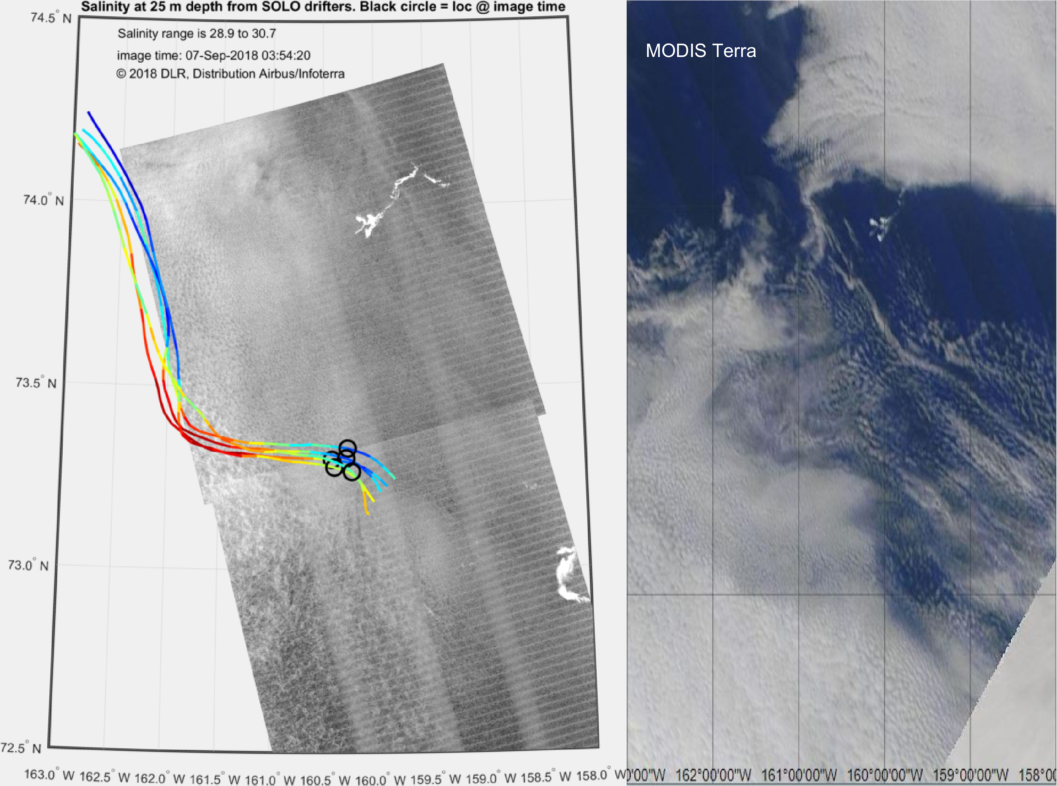
FIGURE 3 |
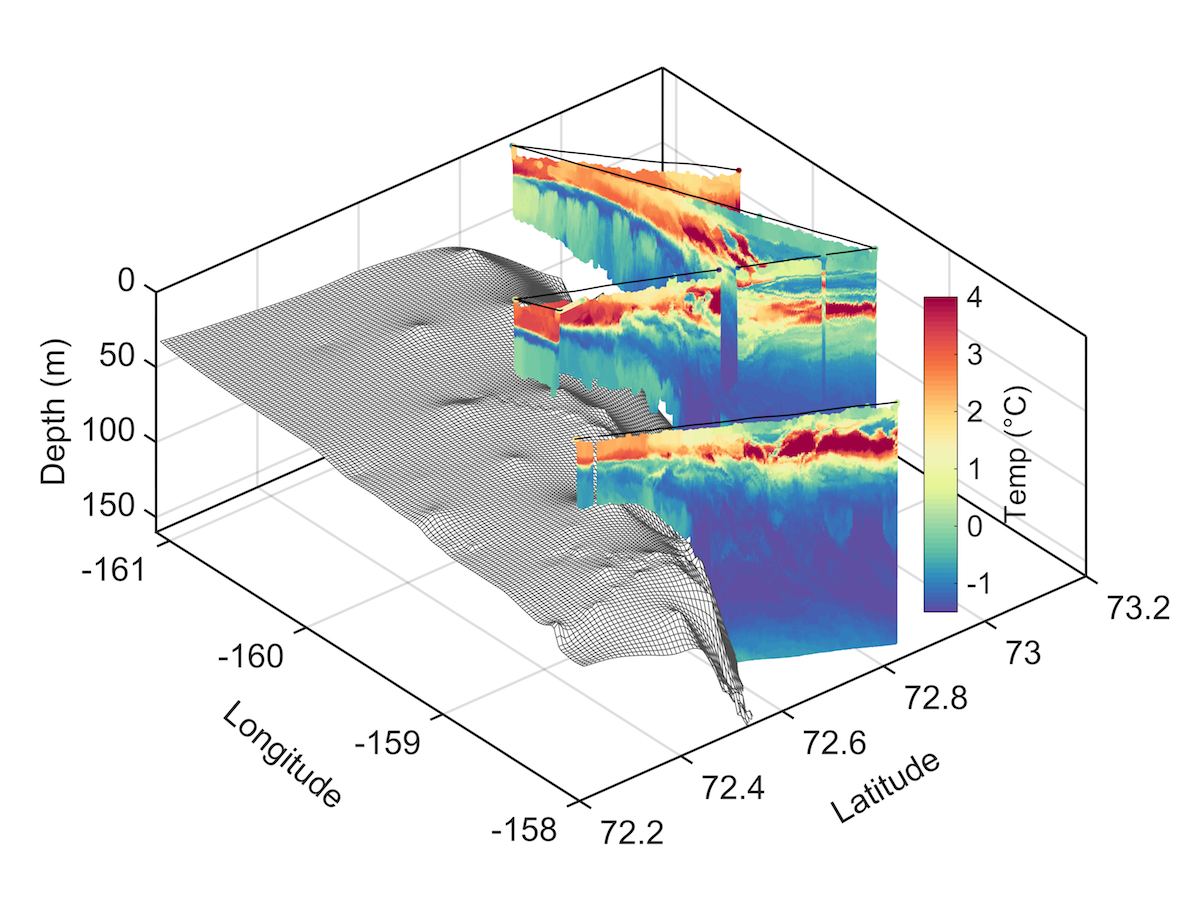
FIGURE 4 |
|
Finally, we're investigating the turbulence associated with all of these processes. Figure 5 shows just one cross-shore line of, from top to bottom, temperature, salinity, turbulent dissipation rate, and ocean currents (U has been rotated to be mostly but clearly not entirely along-slope). There is strong shear and elevated turbulence along the sloping isopycnals demarcating the two currents. A closer look shows subtle banding of both shear and dissipation rate features, which could be related to internal waves, frontal instabilities, or any combination thereof. Not yet included, we conducted 10 CTD casts along the shelf-break and slope, most of which were to collect water samples for our PEANUTS friends in the UK. The secrets they hold are sitting in the deep freeze here on the ship, so we'll have to be a bit more patient for the results, but we are all excited to see how those stories fit in as well. |
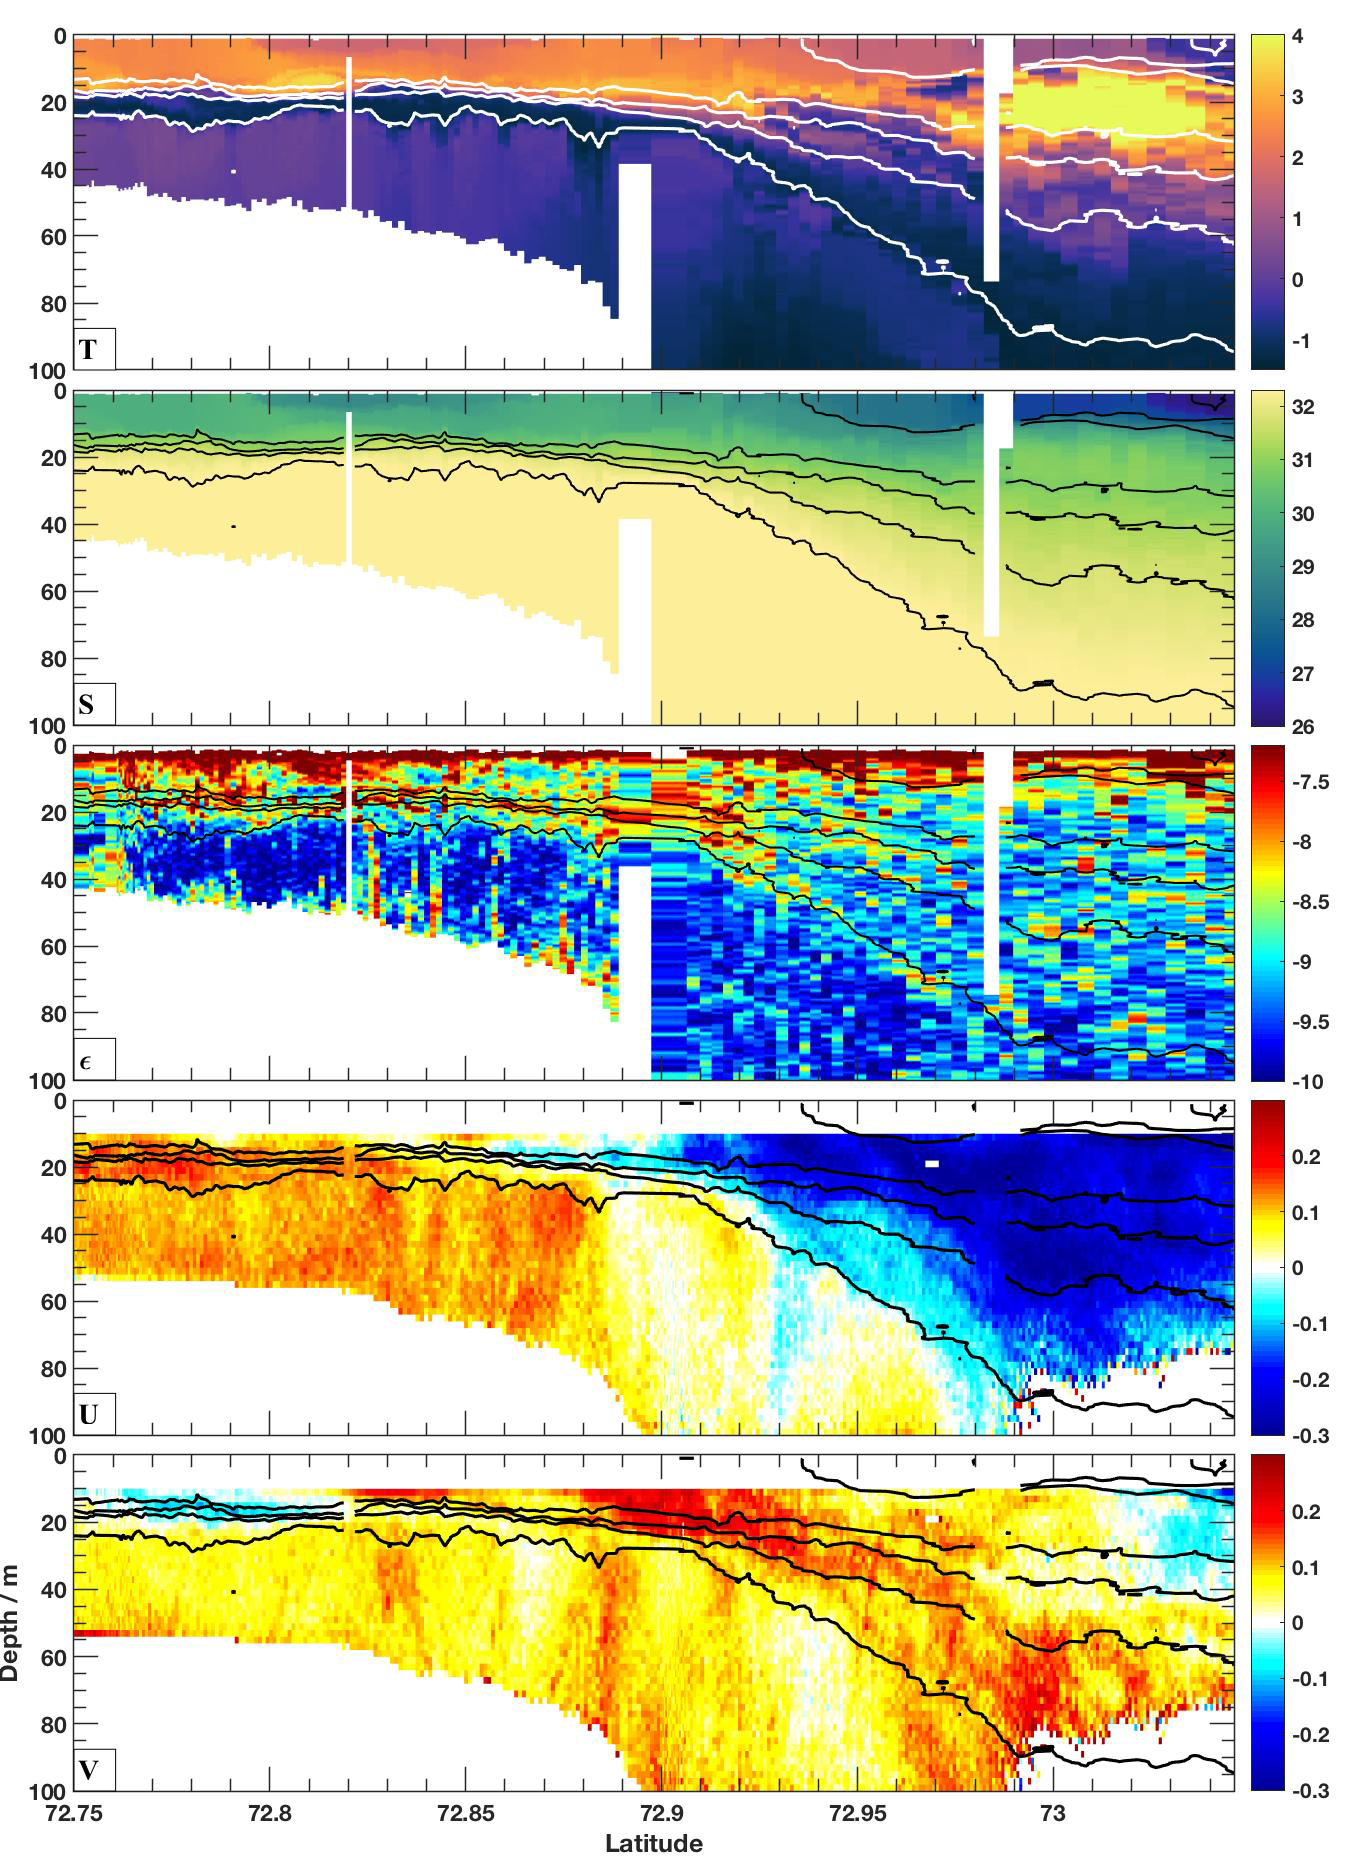
FIGURE 5 |
|
|
|
31 August 2018 |
|
Jennifer MacKinnon, aboard the Sikuliaq The Process Team on the R/V Sikuliaq has spent the last few days in Nome, Alaska, setting up the ship and getting ready to go. While many of our SODA colleagues are focusing on long-term measurements, our role is to take short snapshot, intensive looks at several of the physical processes that we think are linked to accelerate rates of sea ice melt. One general question we're all trying to answer is "What sets the distribution and mixing rates of heat in the upper Arctic Ocean?" Unlike most oceans, ocean density here, particularly in the Arctic Ocean, is set by salinity (not temperature as in most oceans). The surface water tends to be cold and fresh. Beneath that lay various layers of warmer and saltier water. The details of how this warmer water gets into the Arctic, swirls around, and sometimes is mixed back upwards towards the surface matter, as they set the propensity of that heat to either passively lurk or release heat for melting sea ice. We're bringing with us a variety of tools for sampling these processes both from the ship and drifting/gliding platforms nearby. We'll post more details of the various measurements, science questions, and people onboard as we go along. But to start us off (while we still have high bandwidth on shore) here are some photos of our activities for the last several days. |
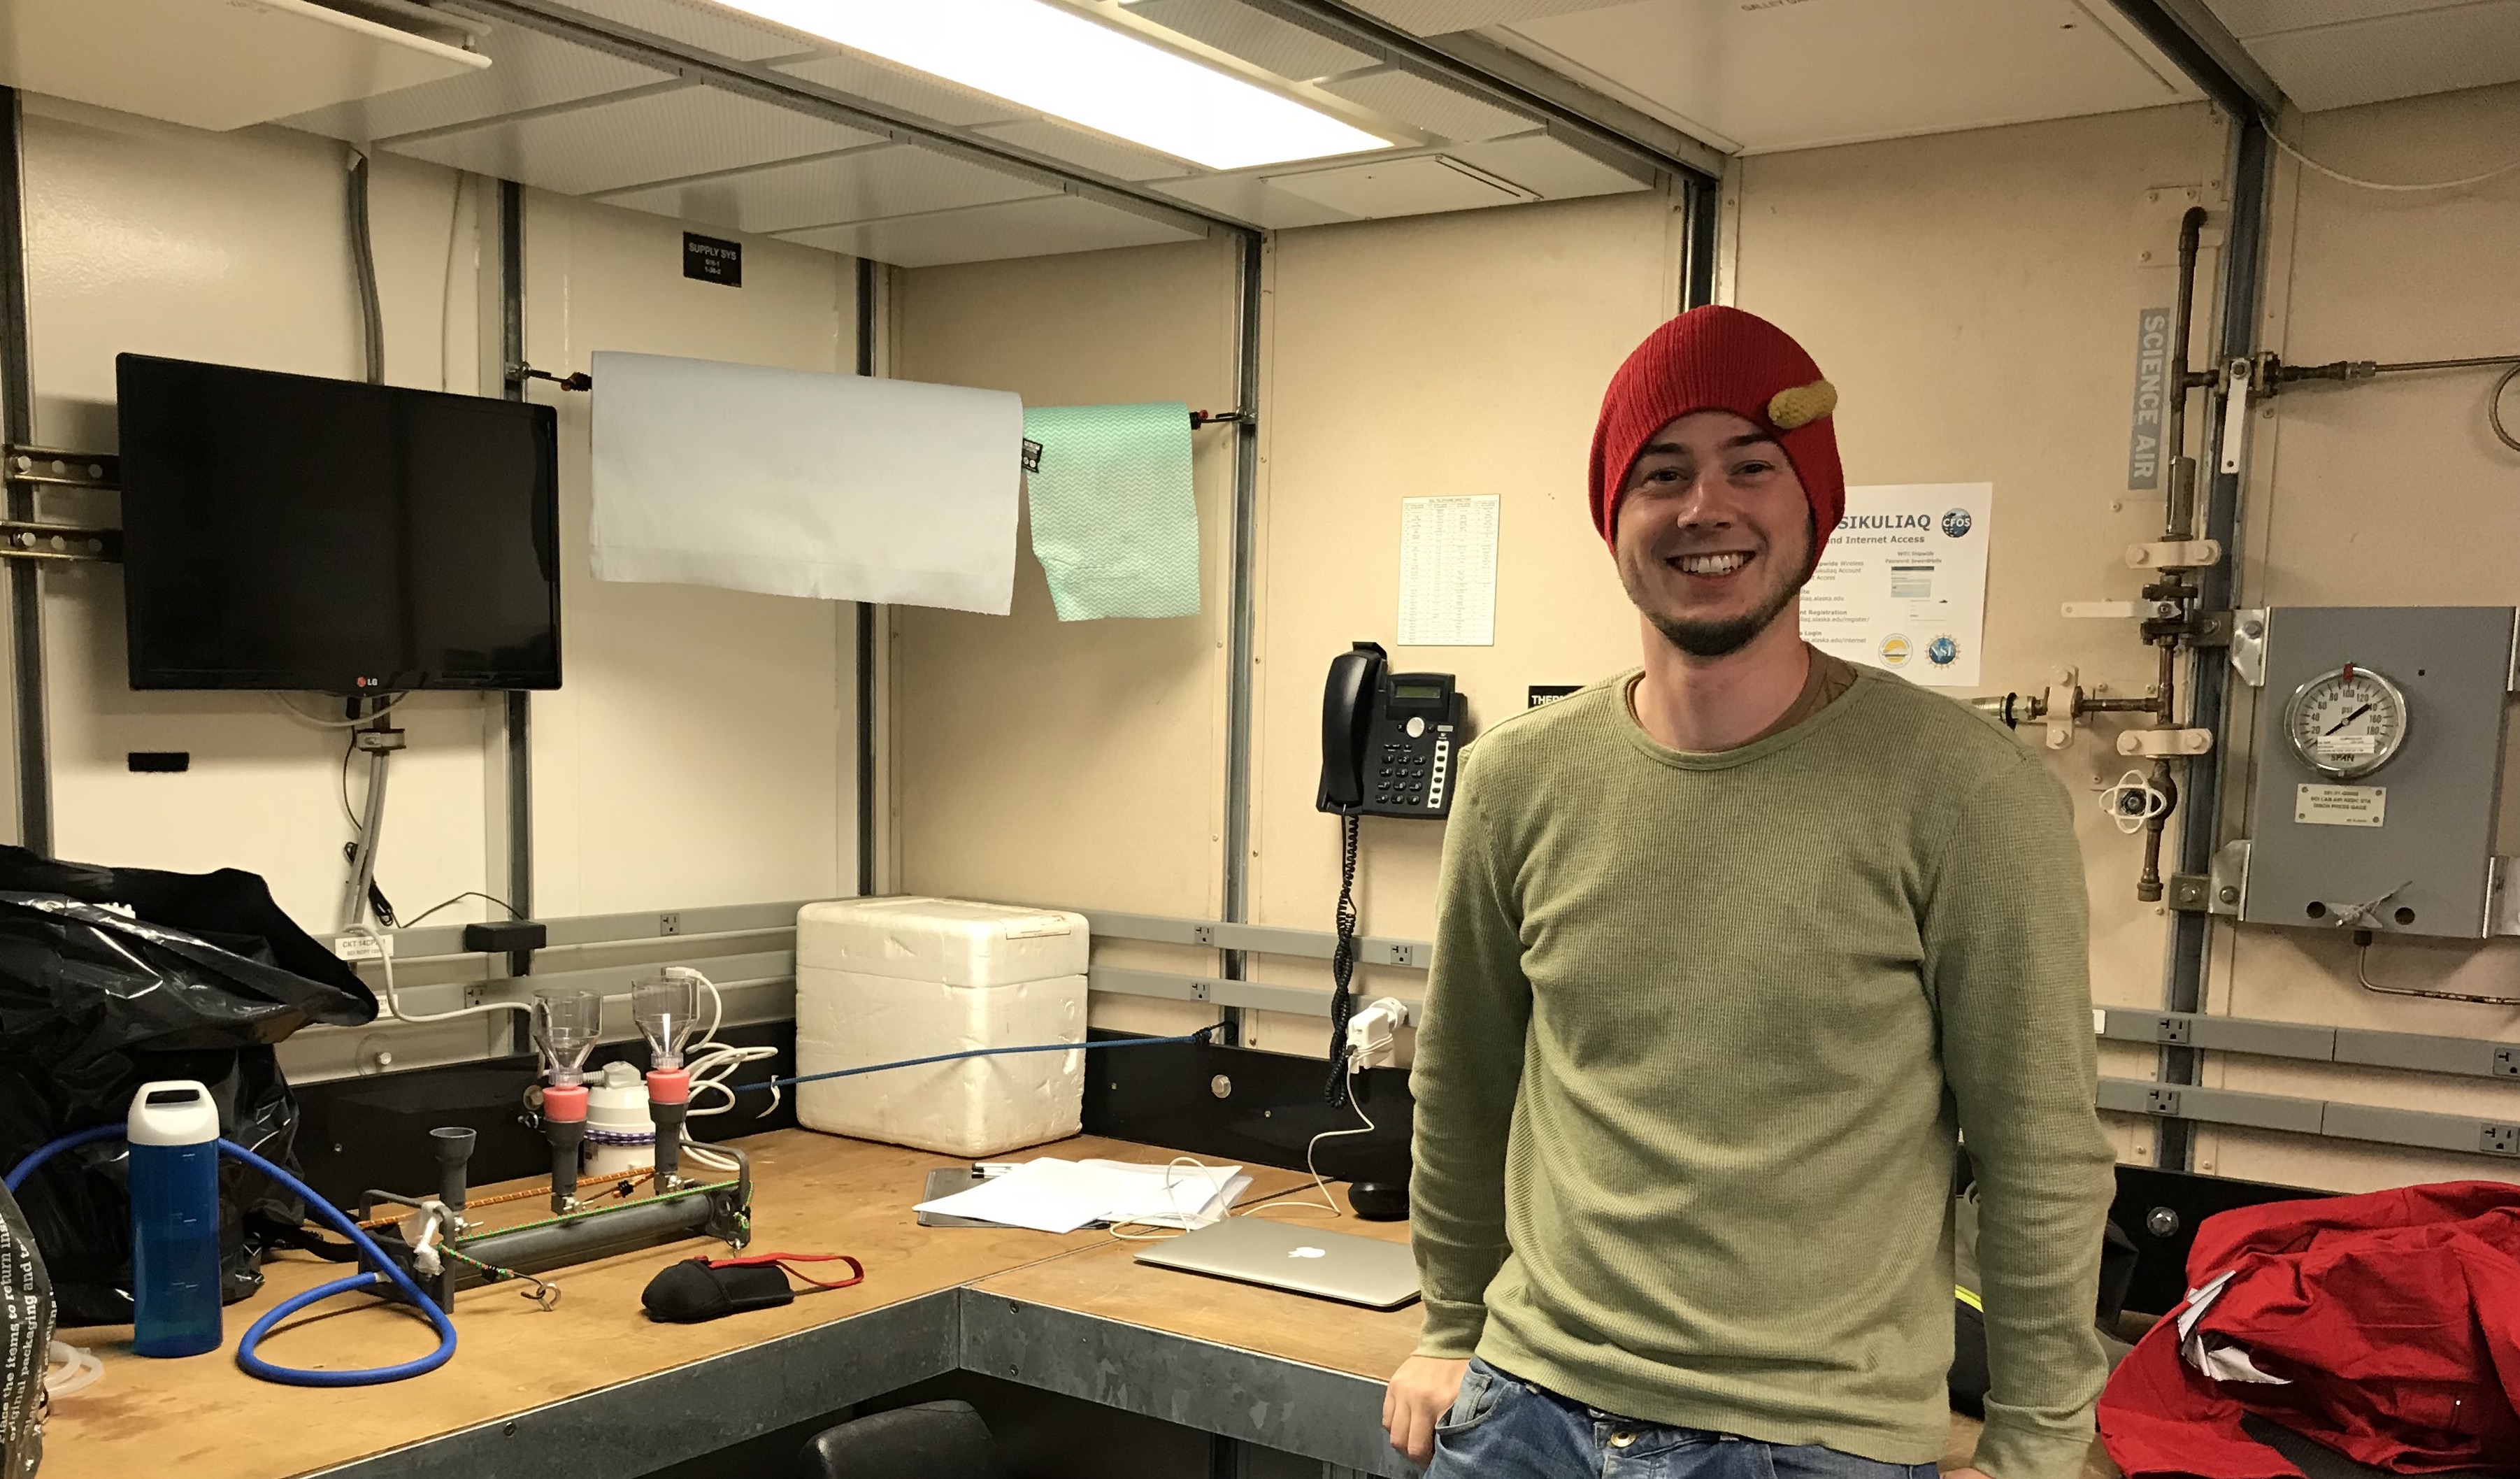
Student Ben Barton joins us from Bangor University to help us link physical changes in the Arctic with changing ecosystems through the UK PEANUTS program. 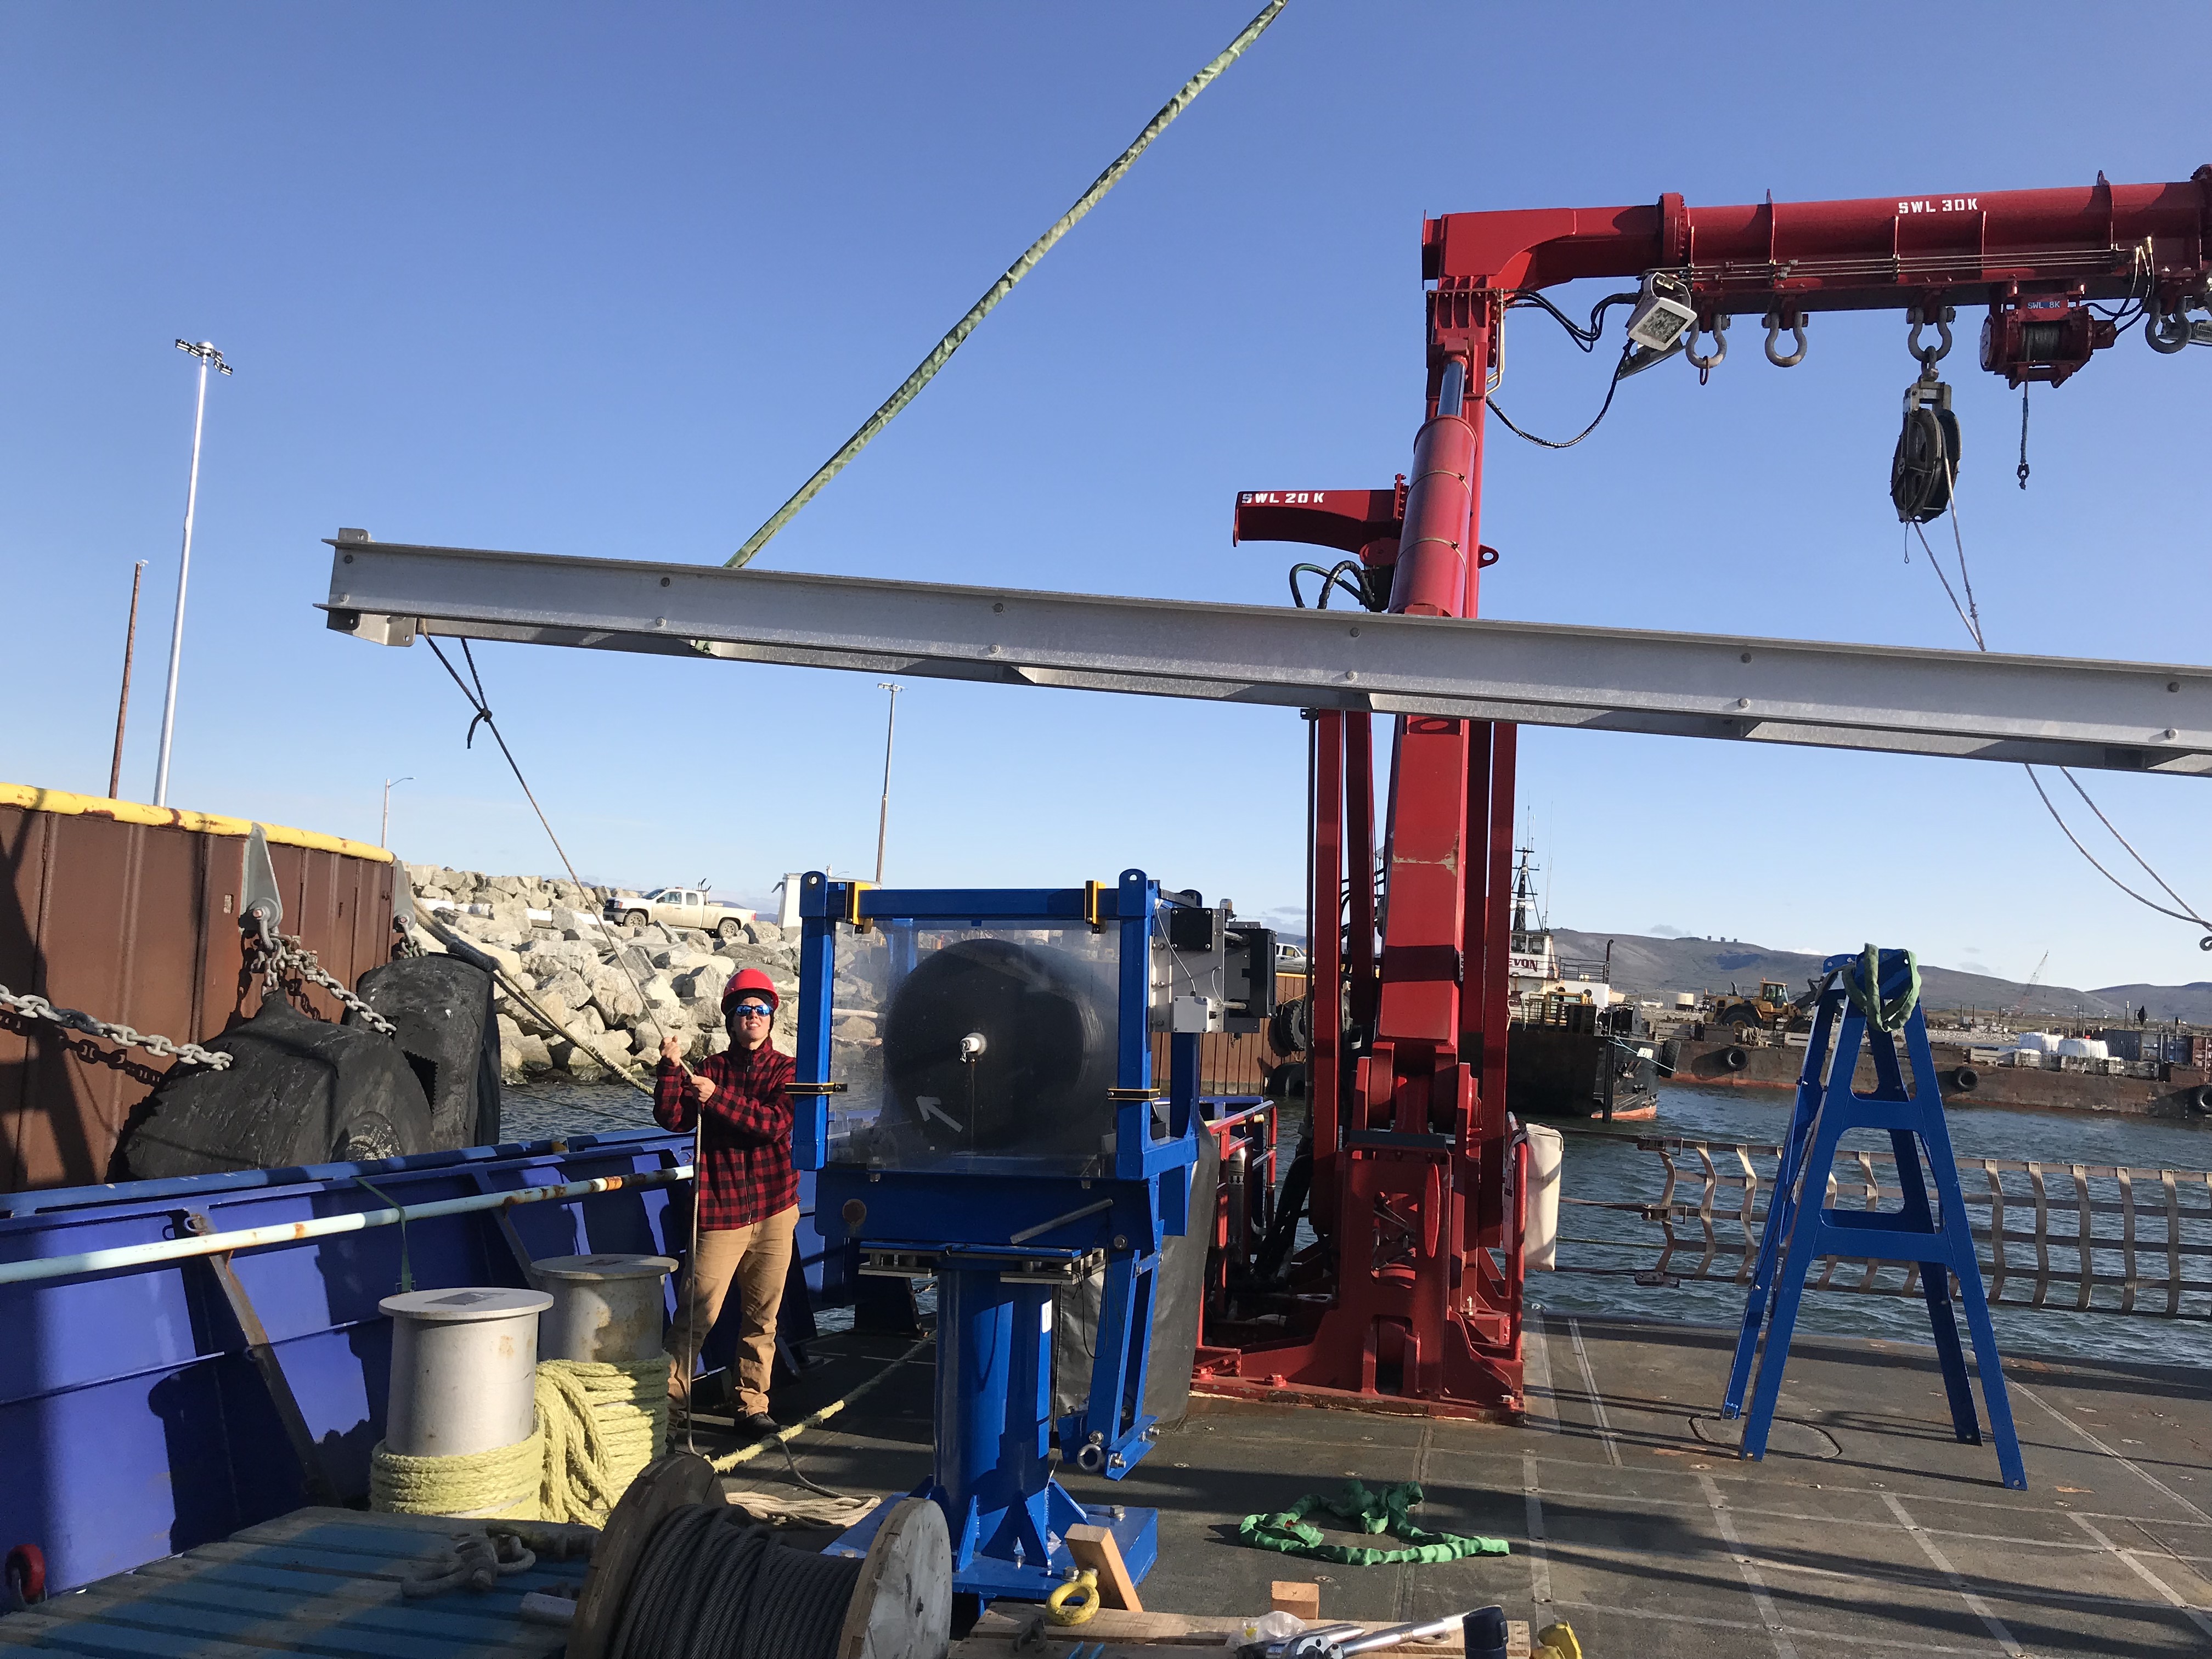
Engineer Sara Goheen guides the 'Fast CTD' boom into place. |
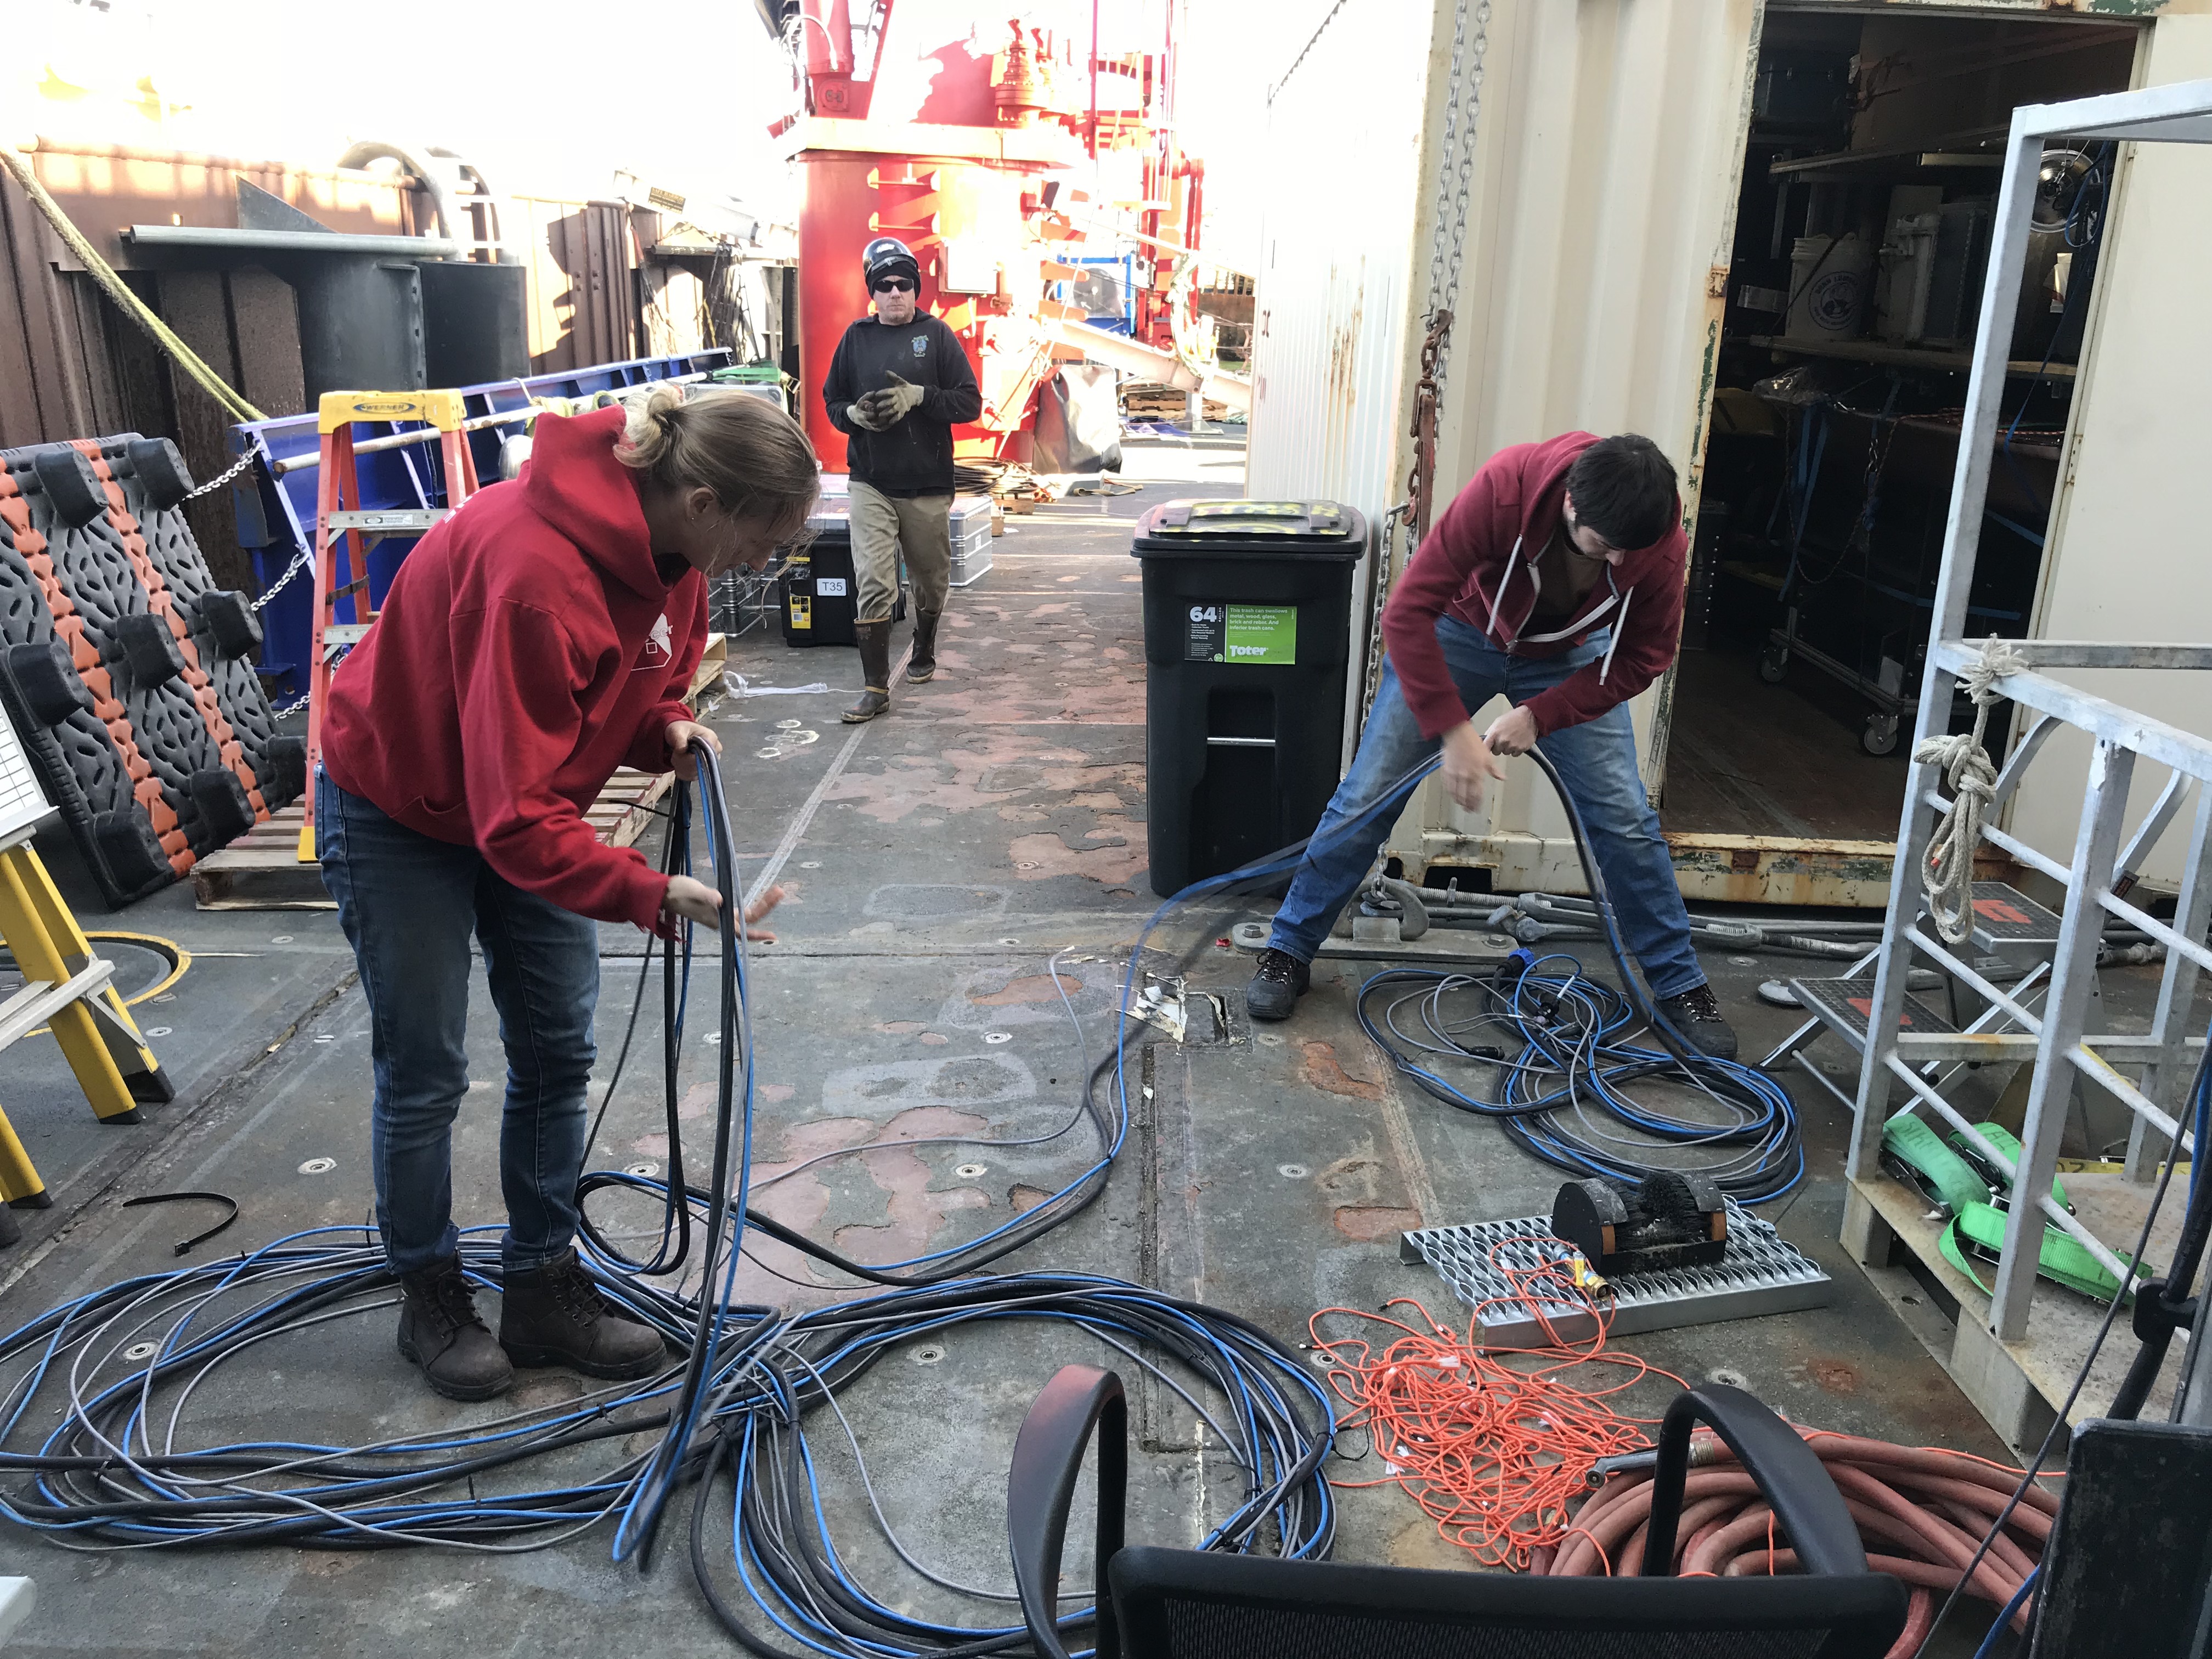
Graduate students Effie Fine and Giulo Meille sort through the miles of cables that connect all our instruments to the central station in the ship's lab where we monitor them continuously. 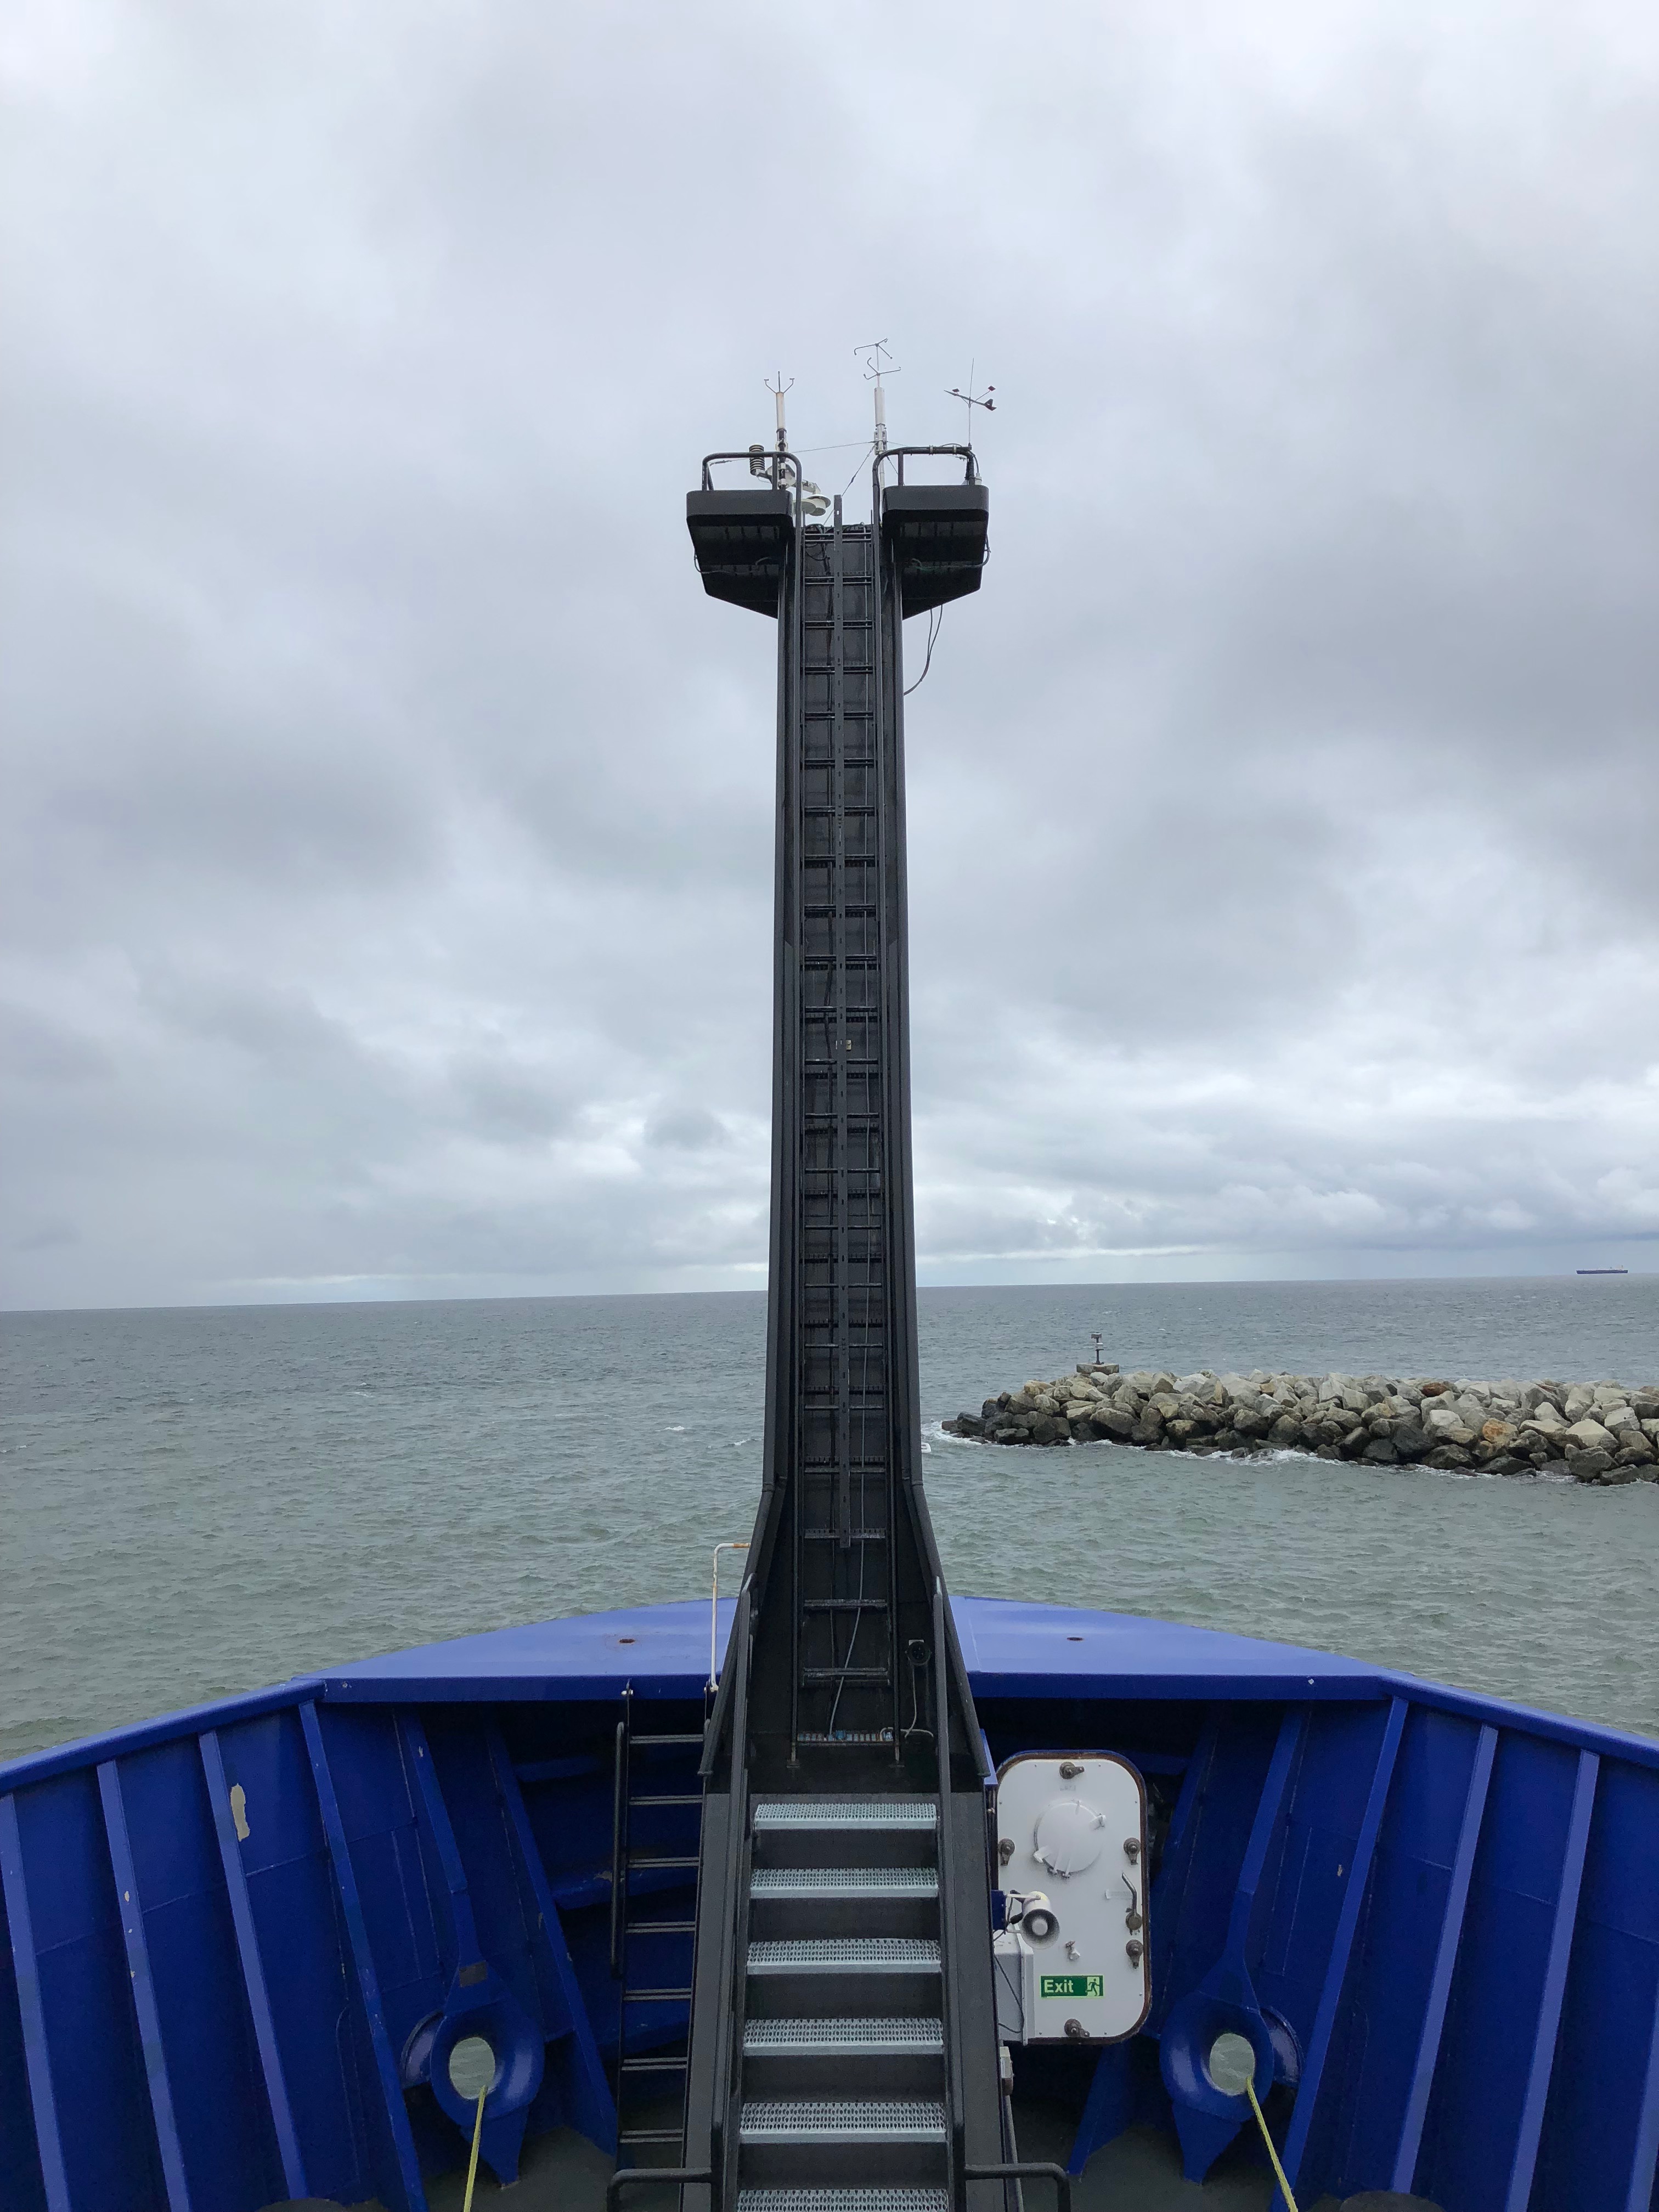
Jim Thomson's group at APL-UW has installed specialized instruments to study the details of turbulent fluxes in the atmosphere, and how they respond to changing ocean temperatures and ice conditions. |
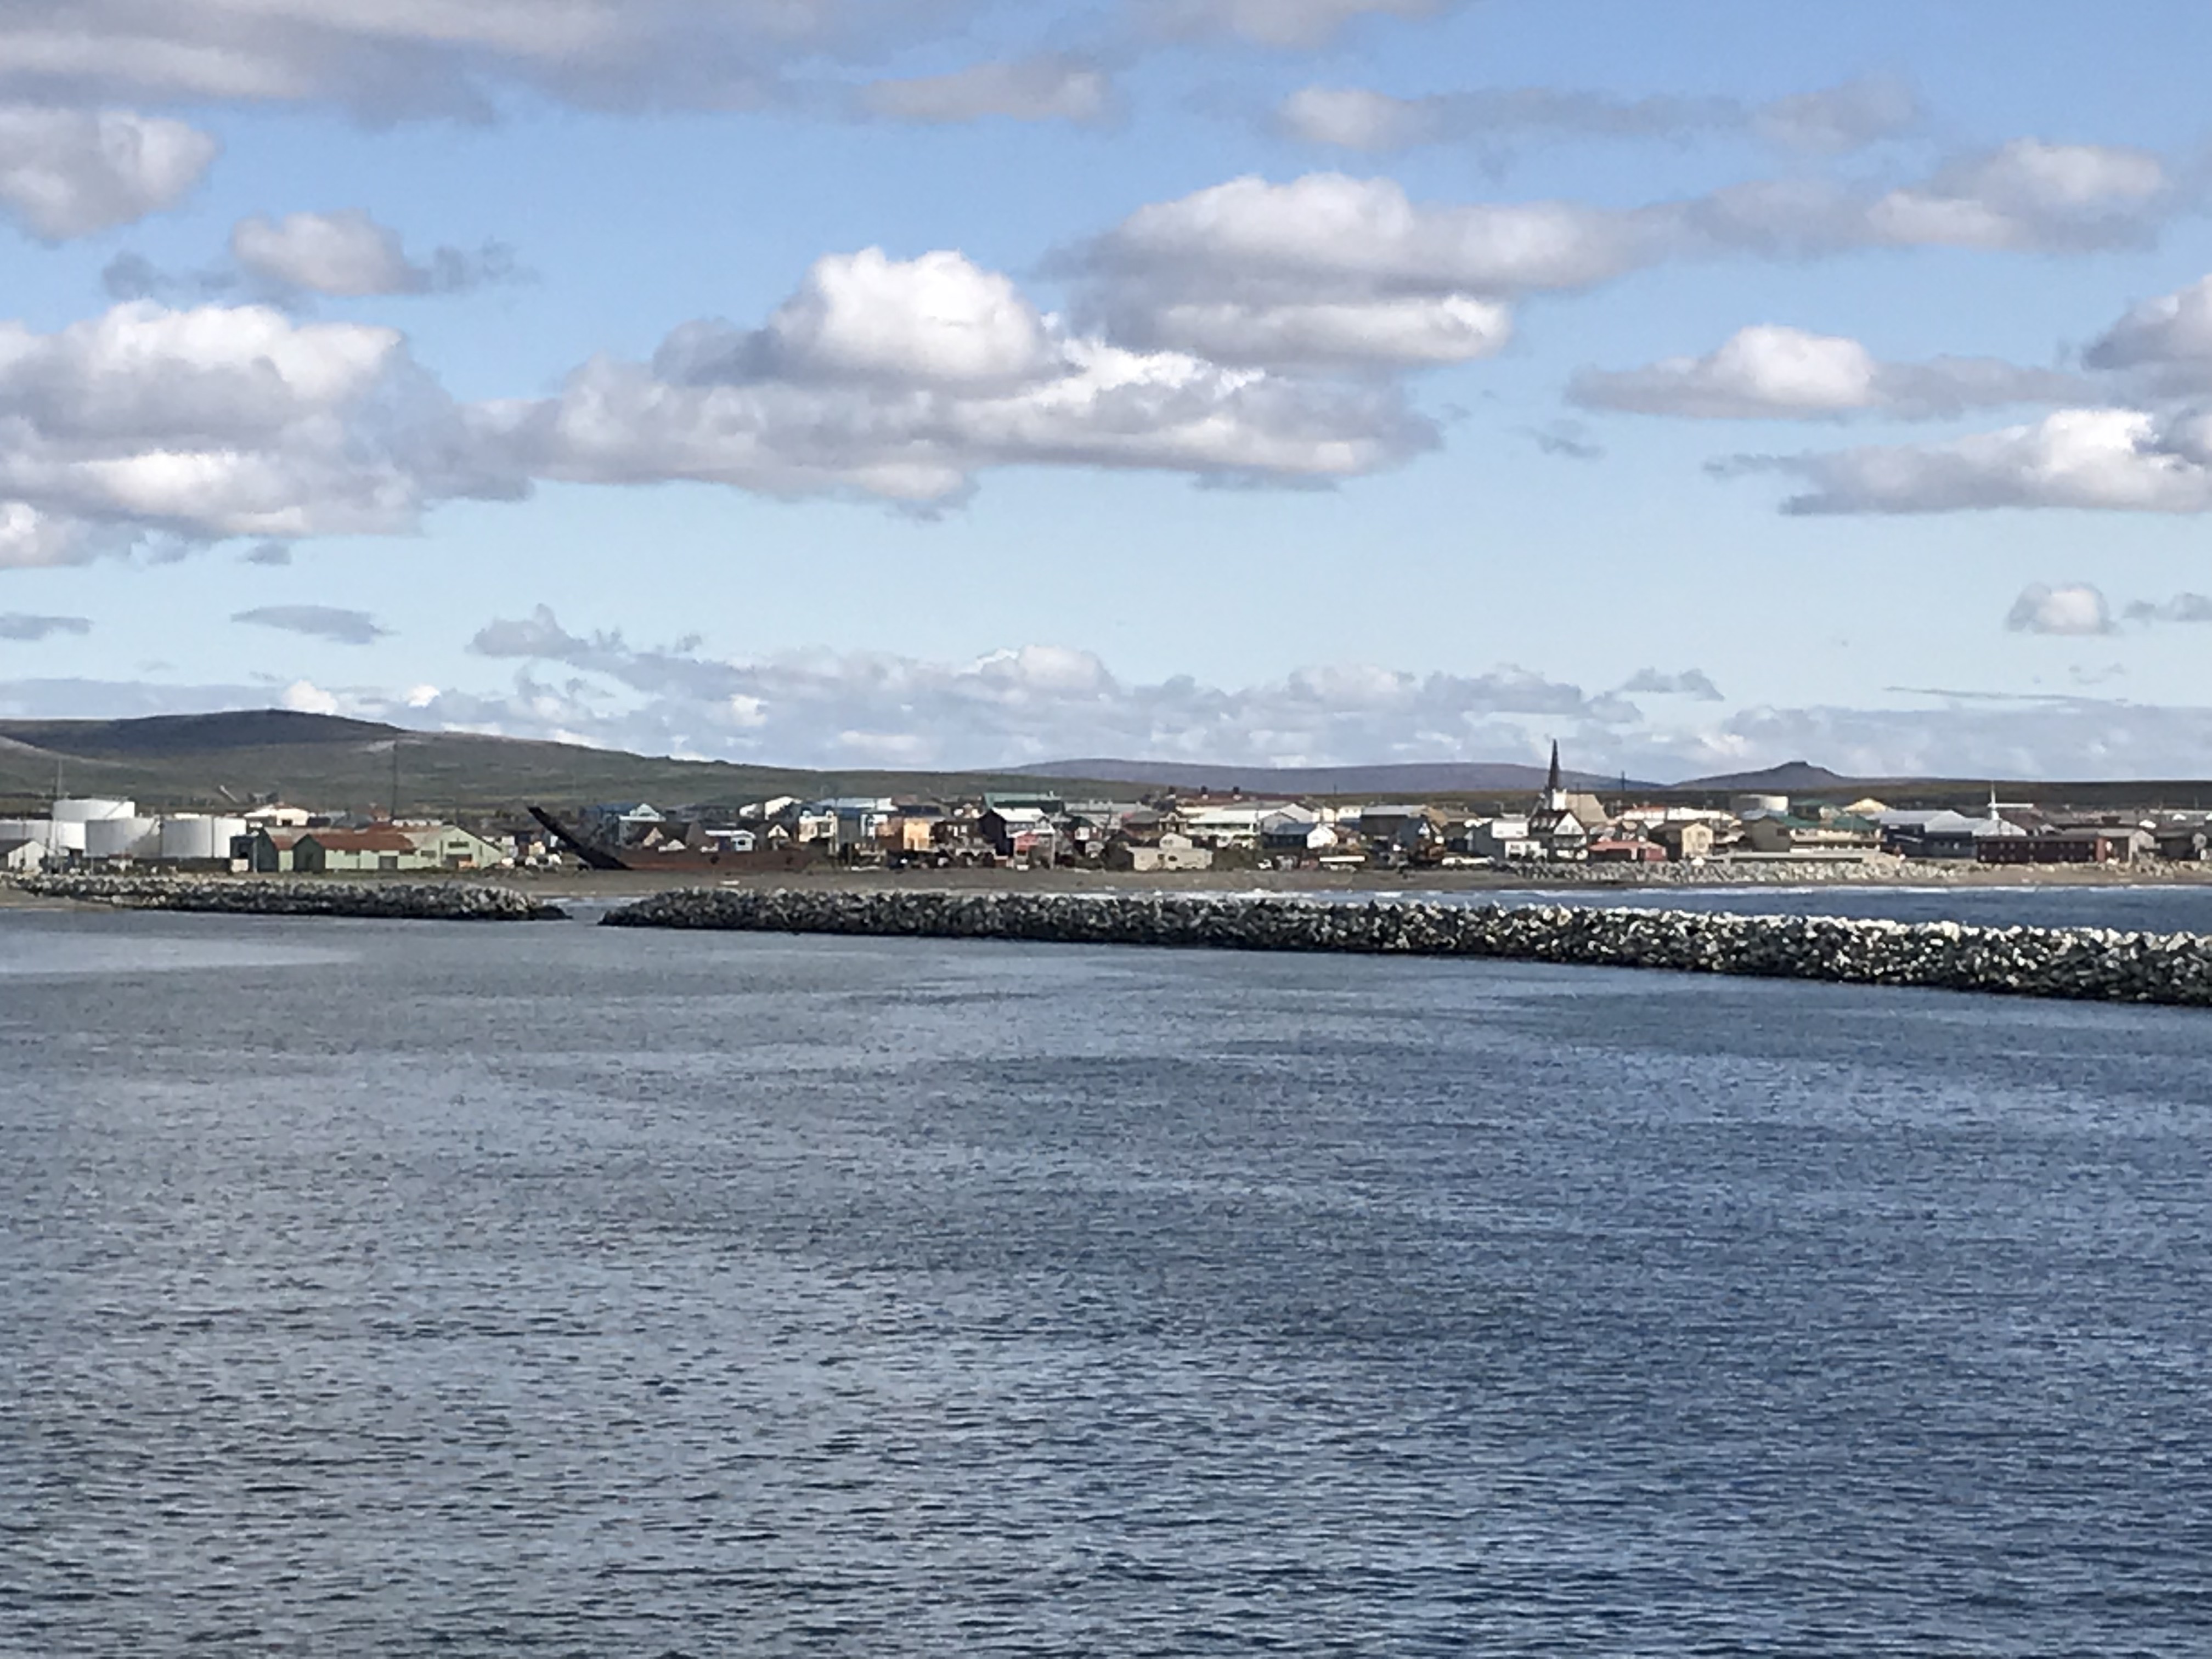
Nome, Alaska 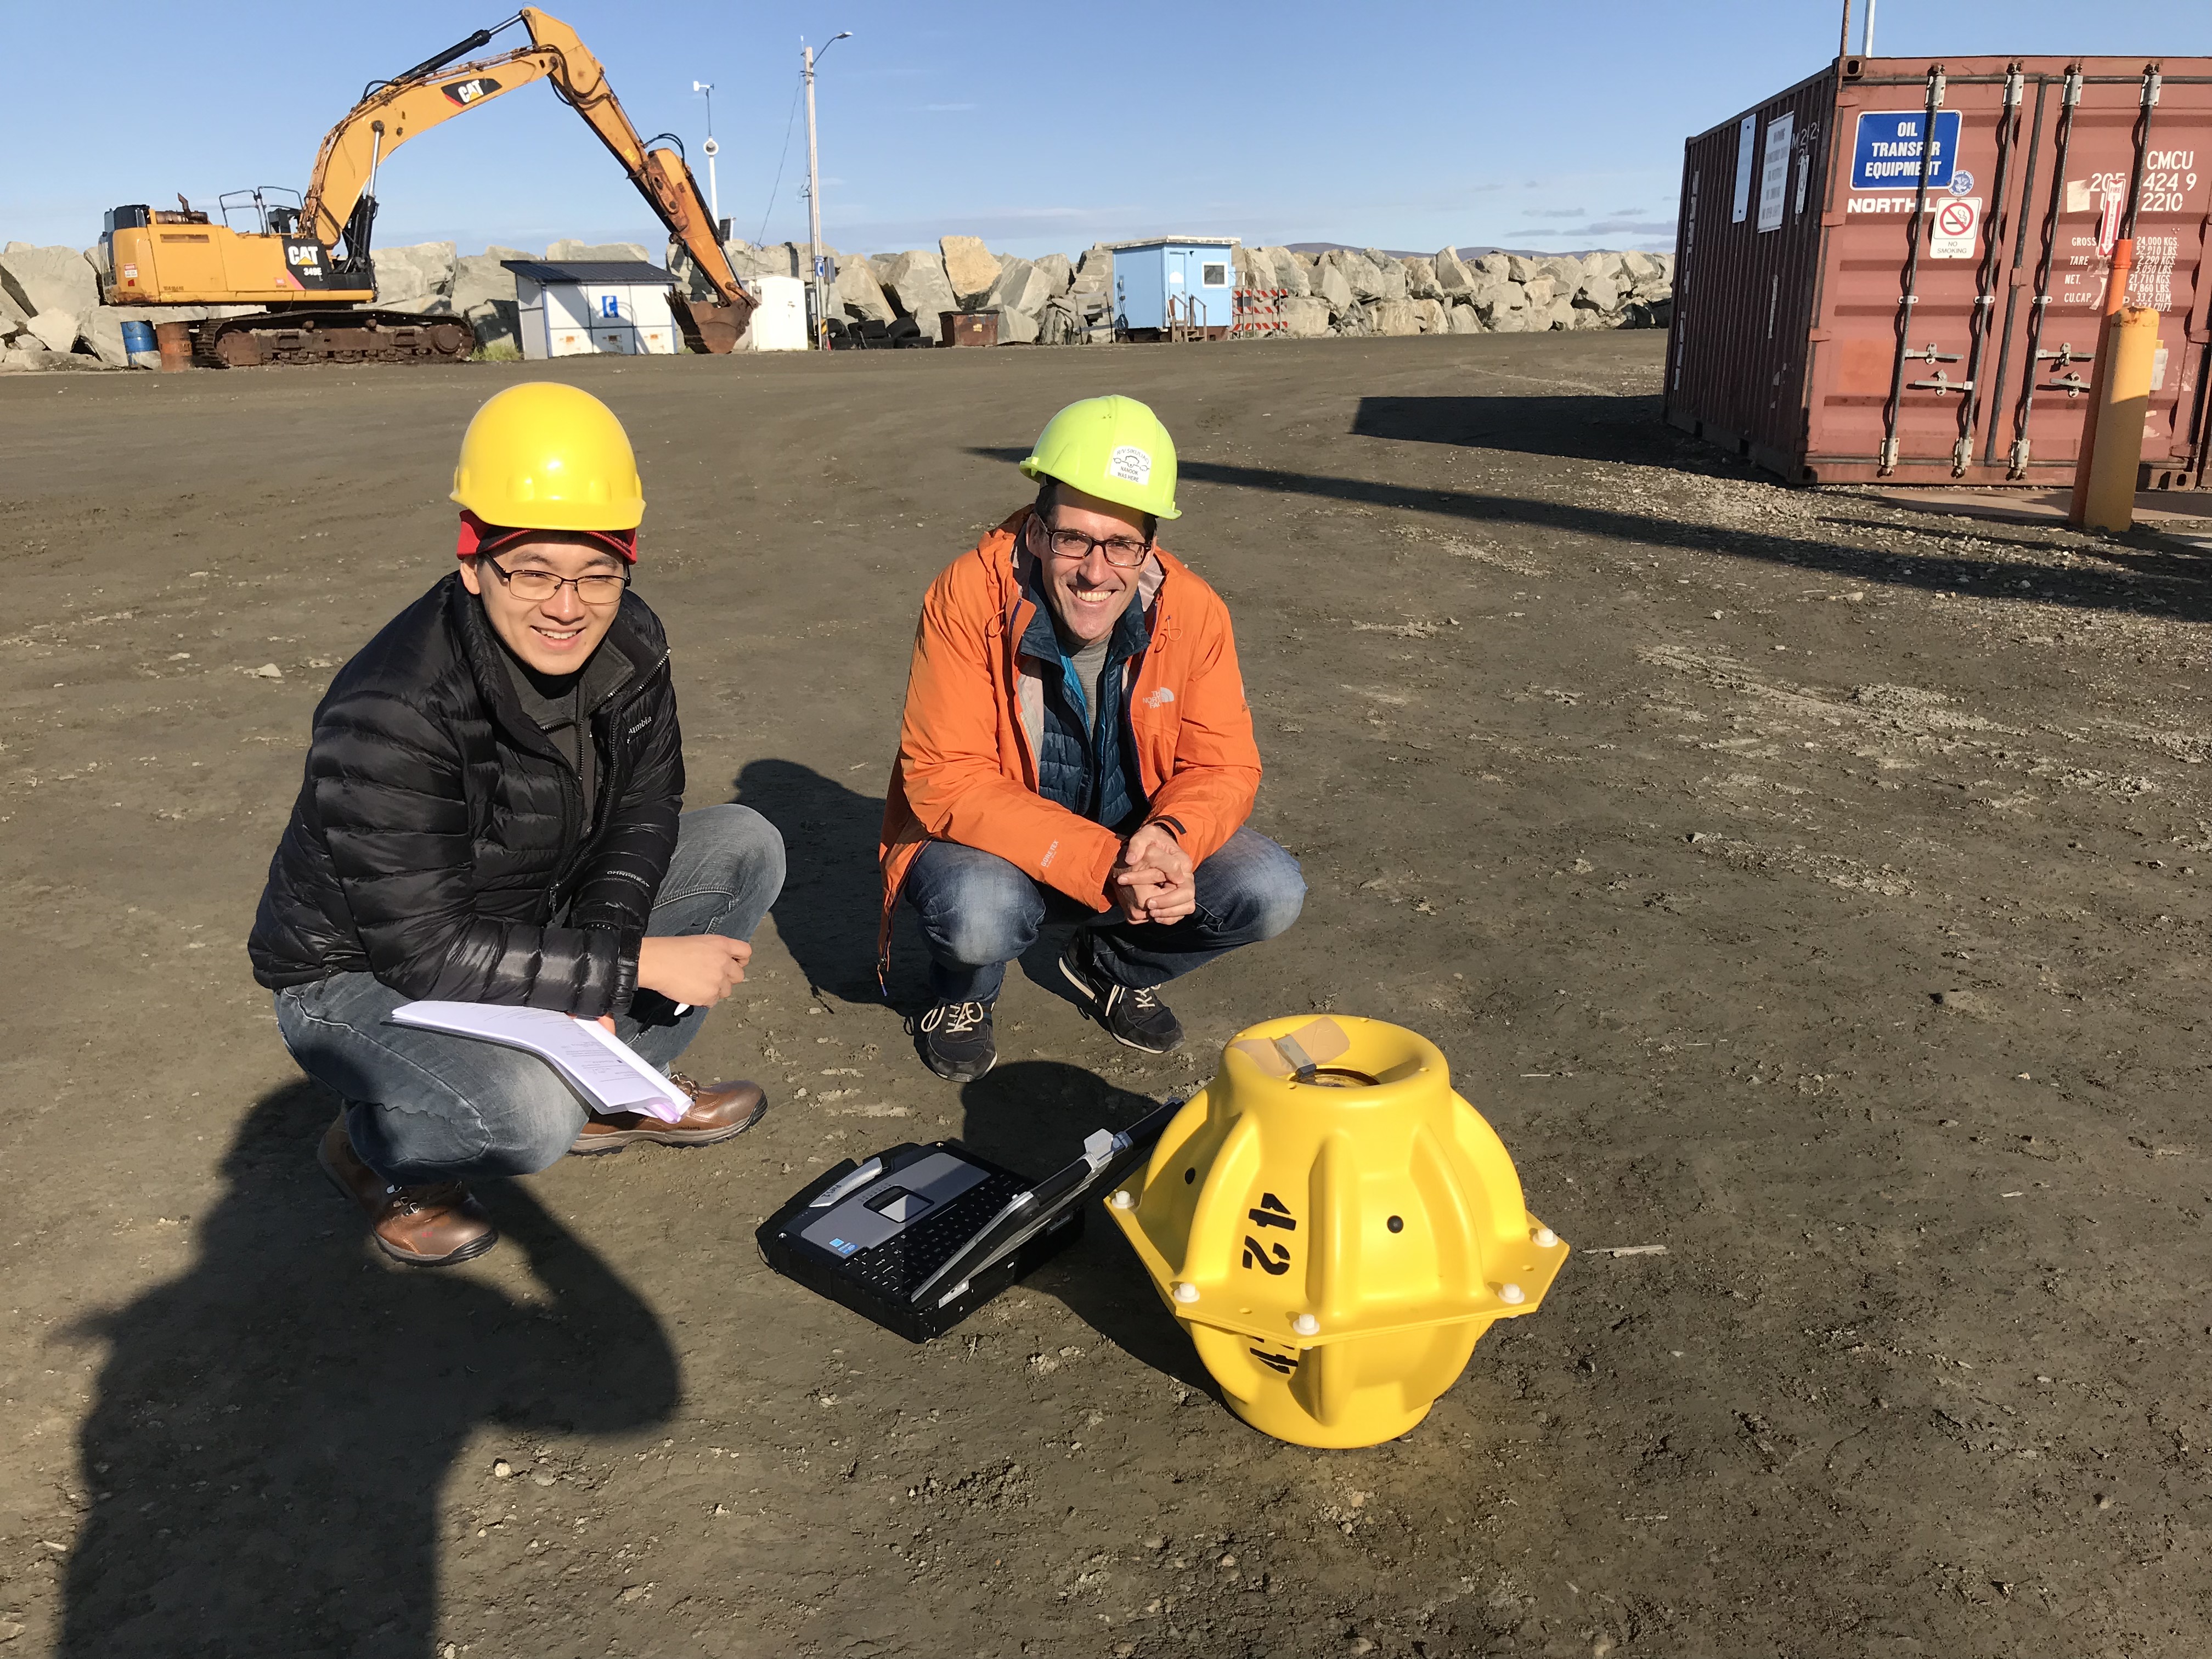
Tom Peacock and Chanhyung Jeon prep PIES instruments for deployment. |
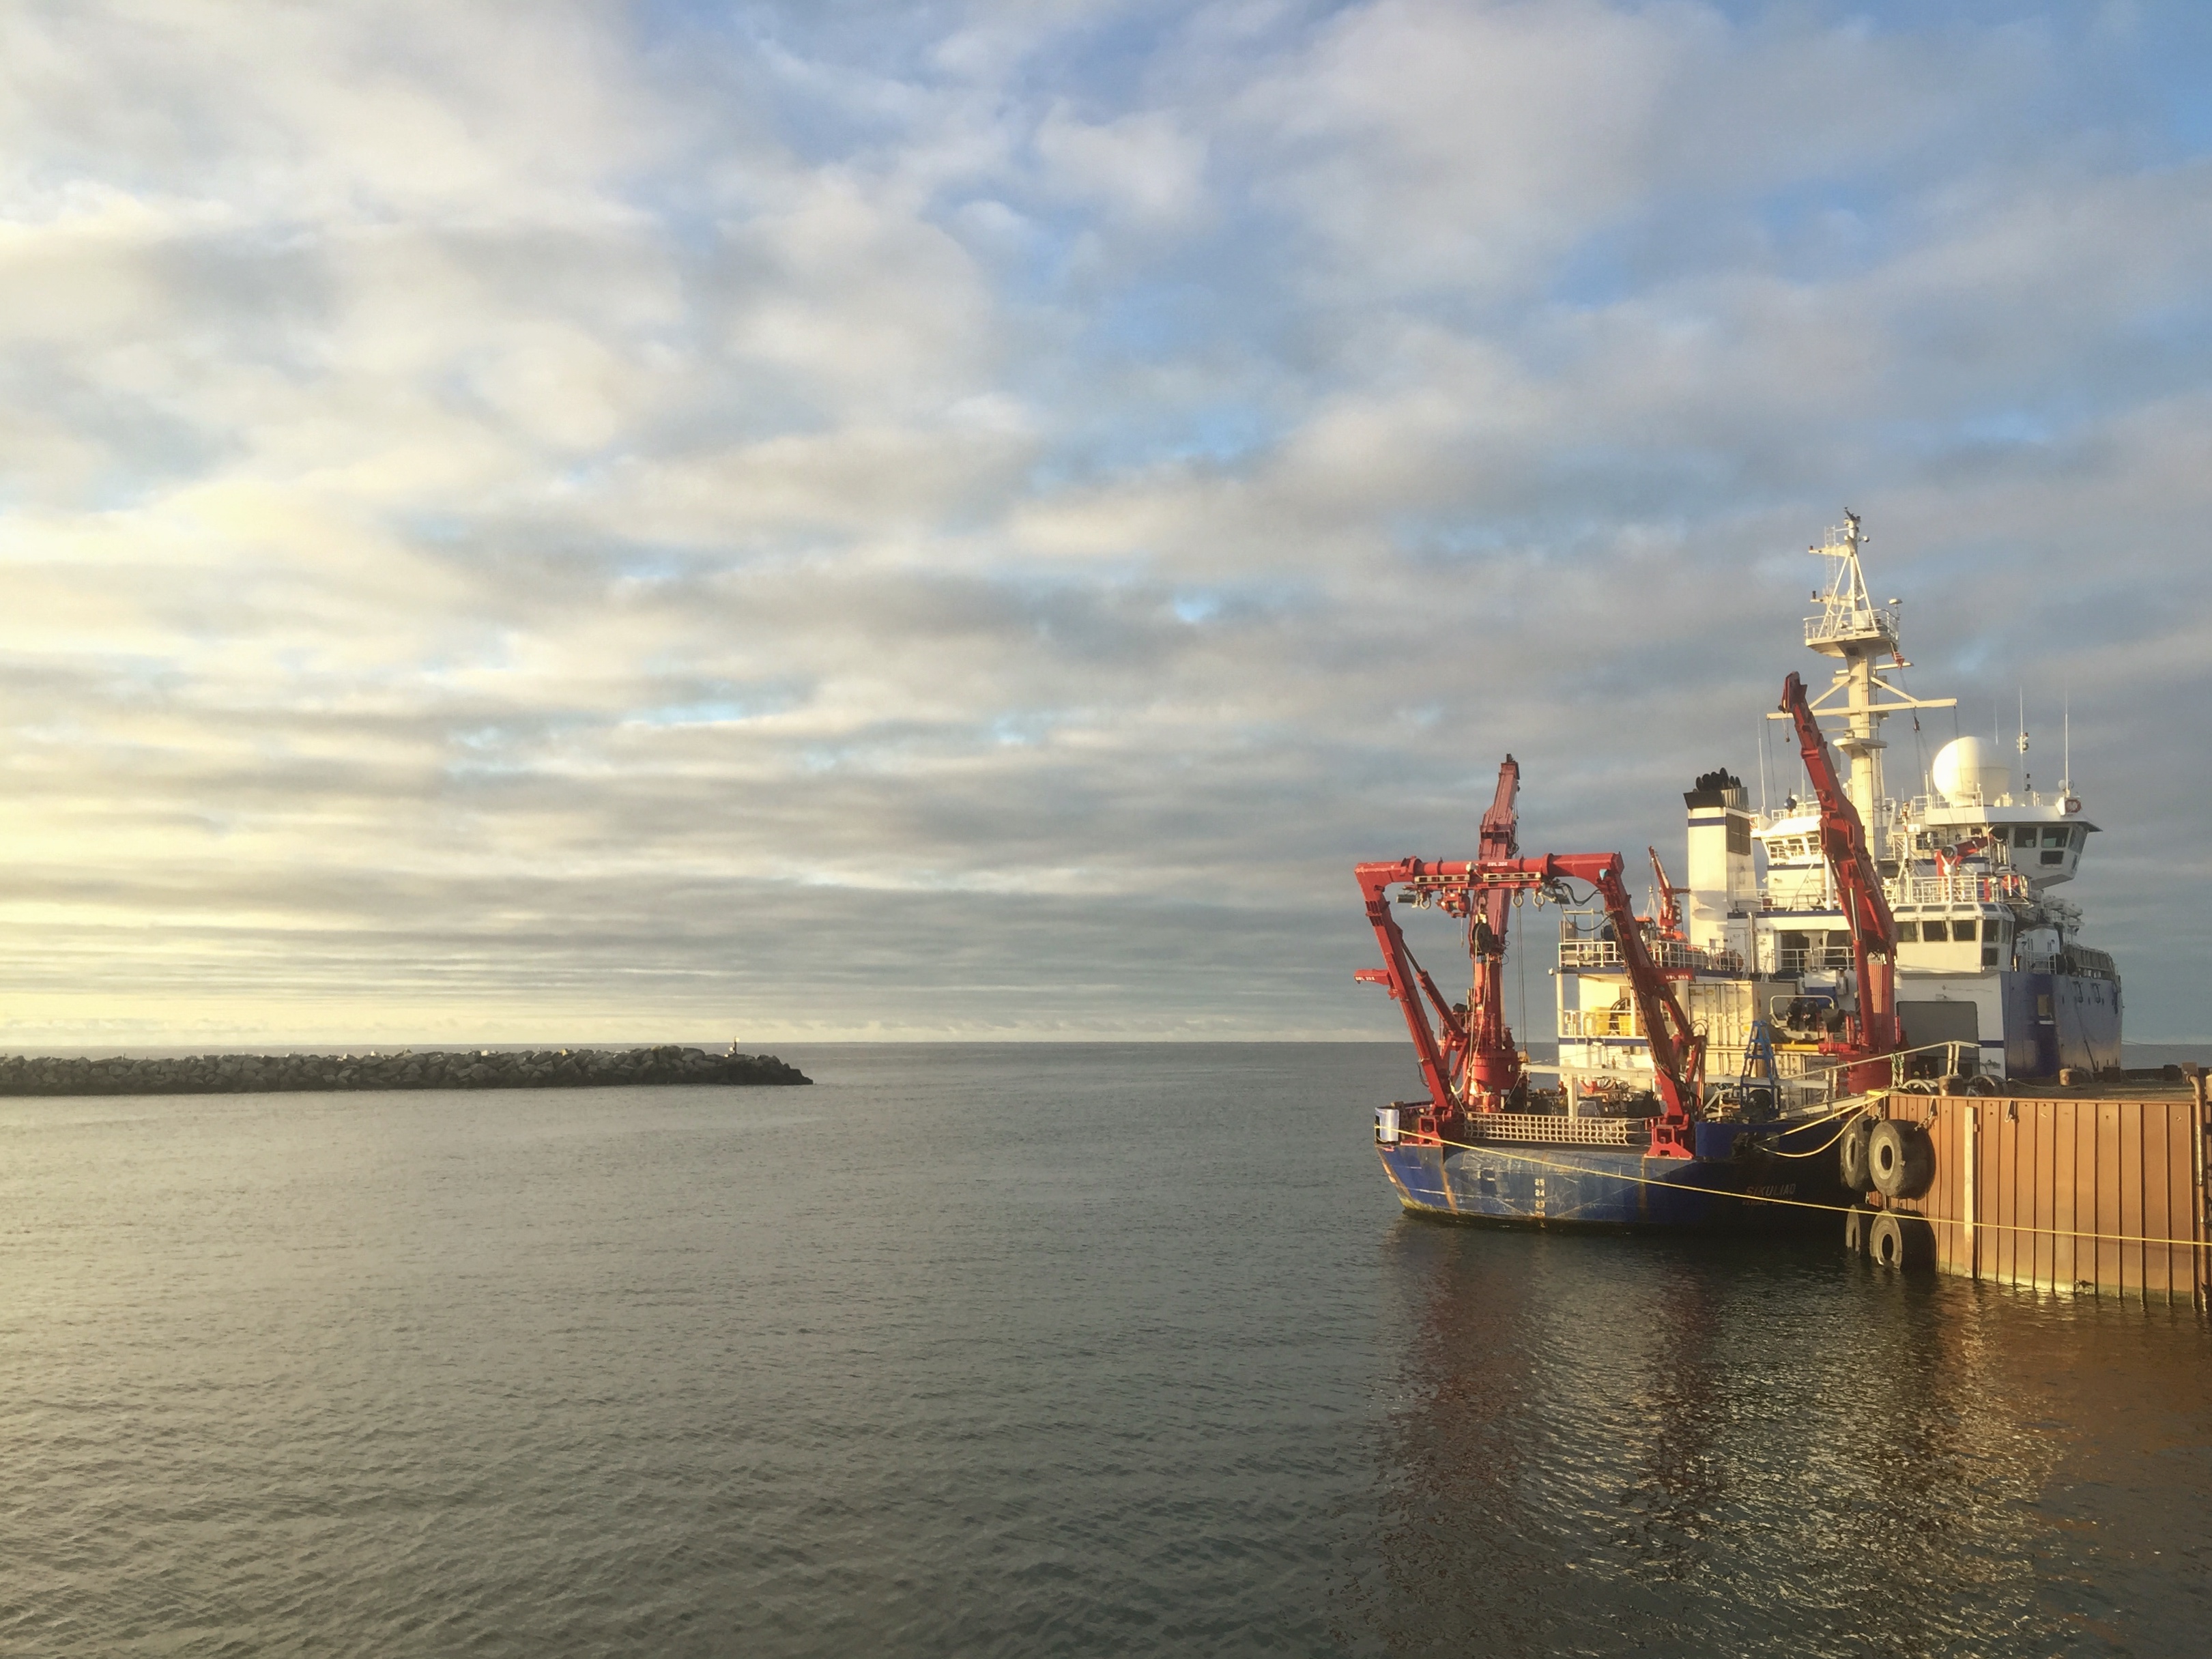
The R/V Sikuliaq, our home for the next month. 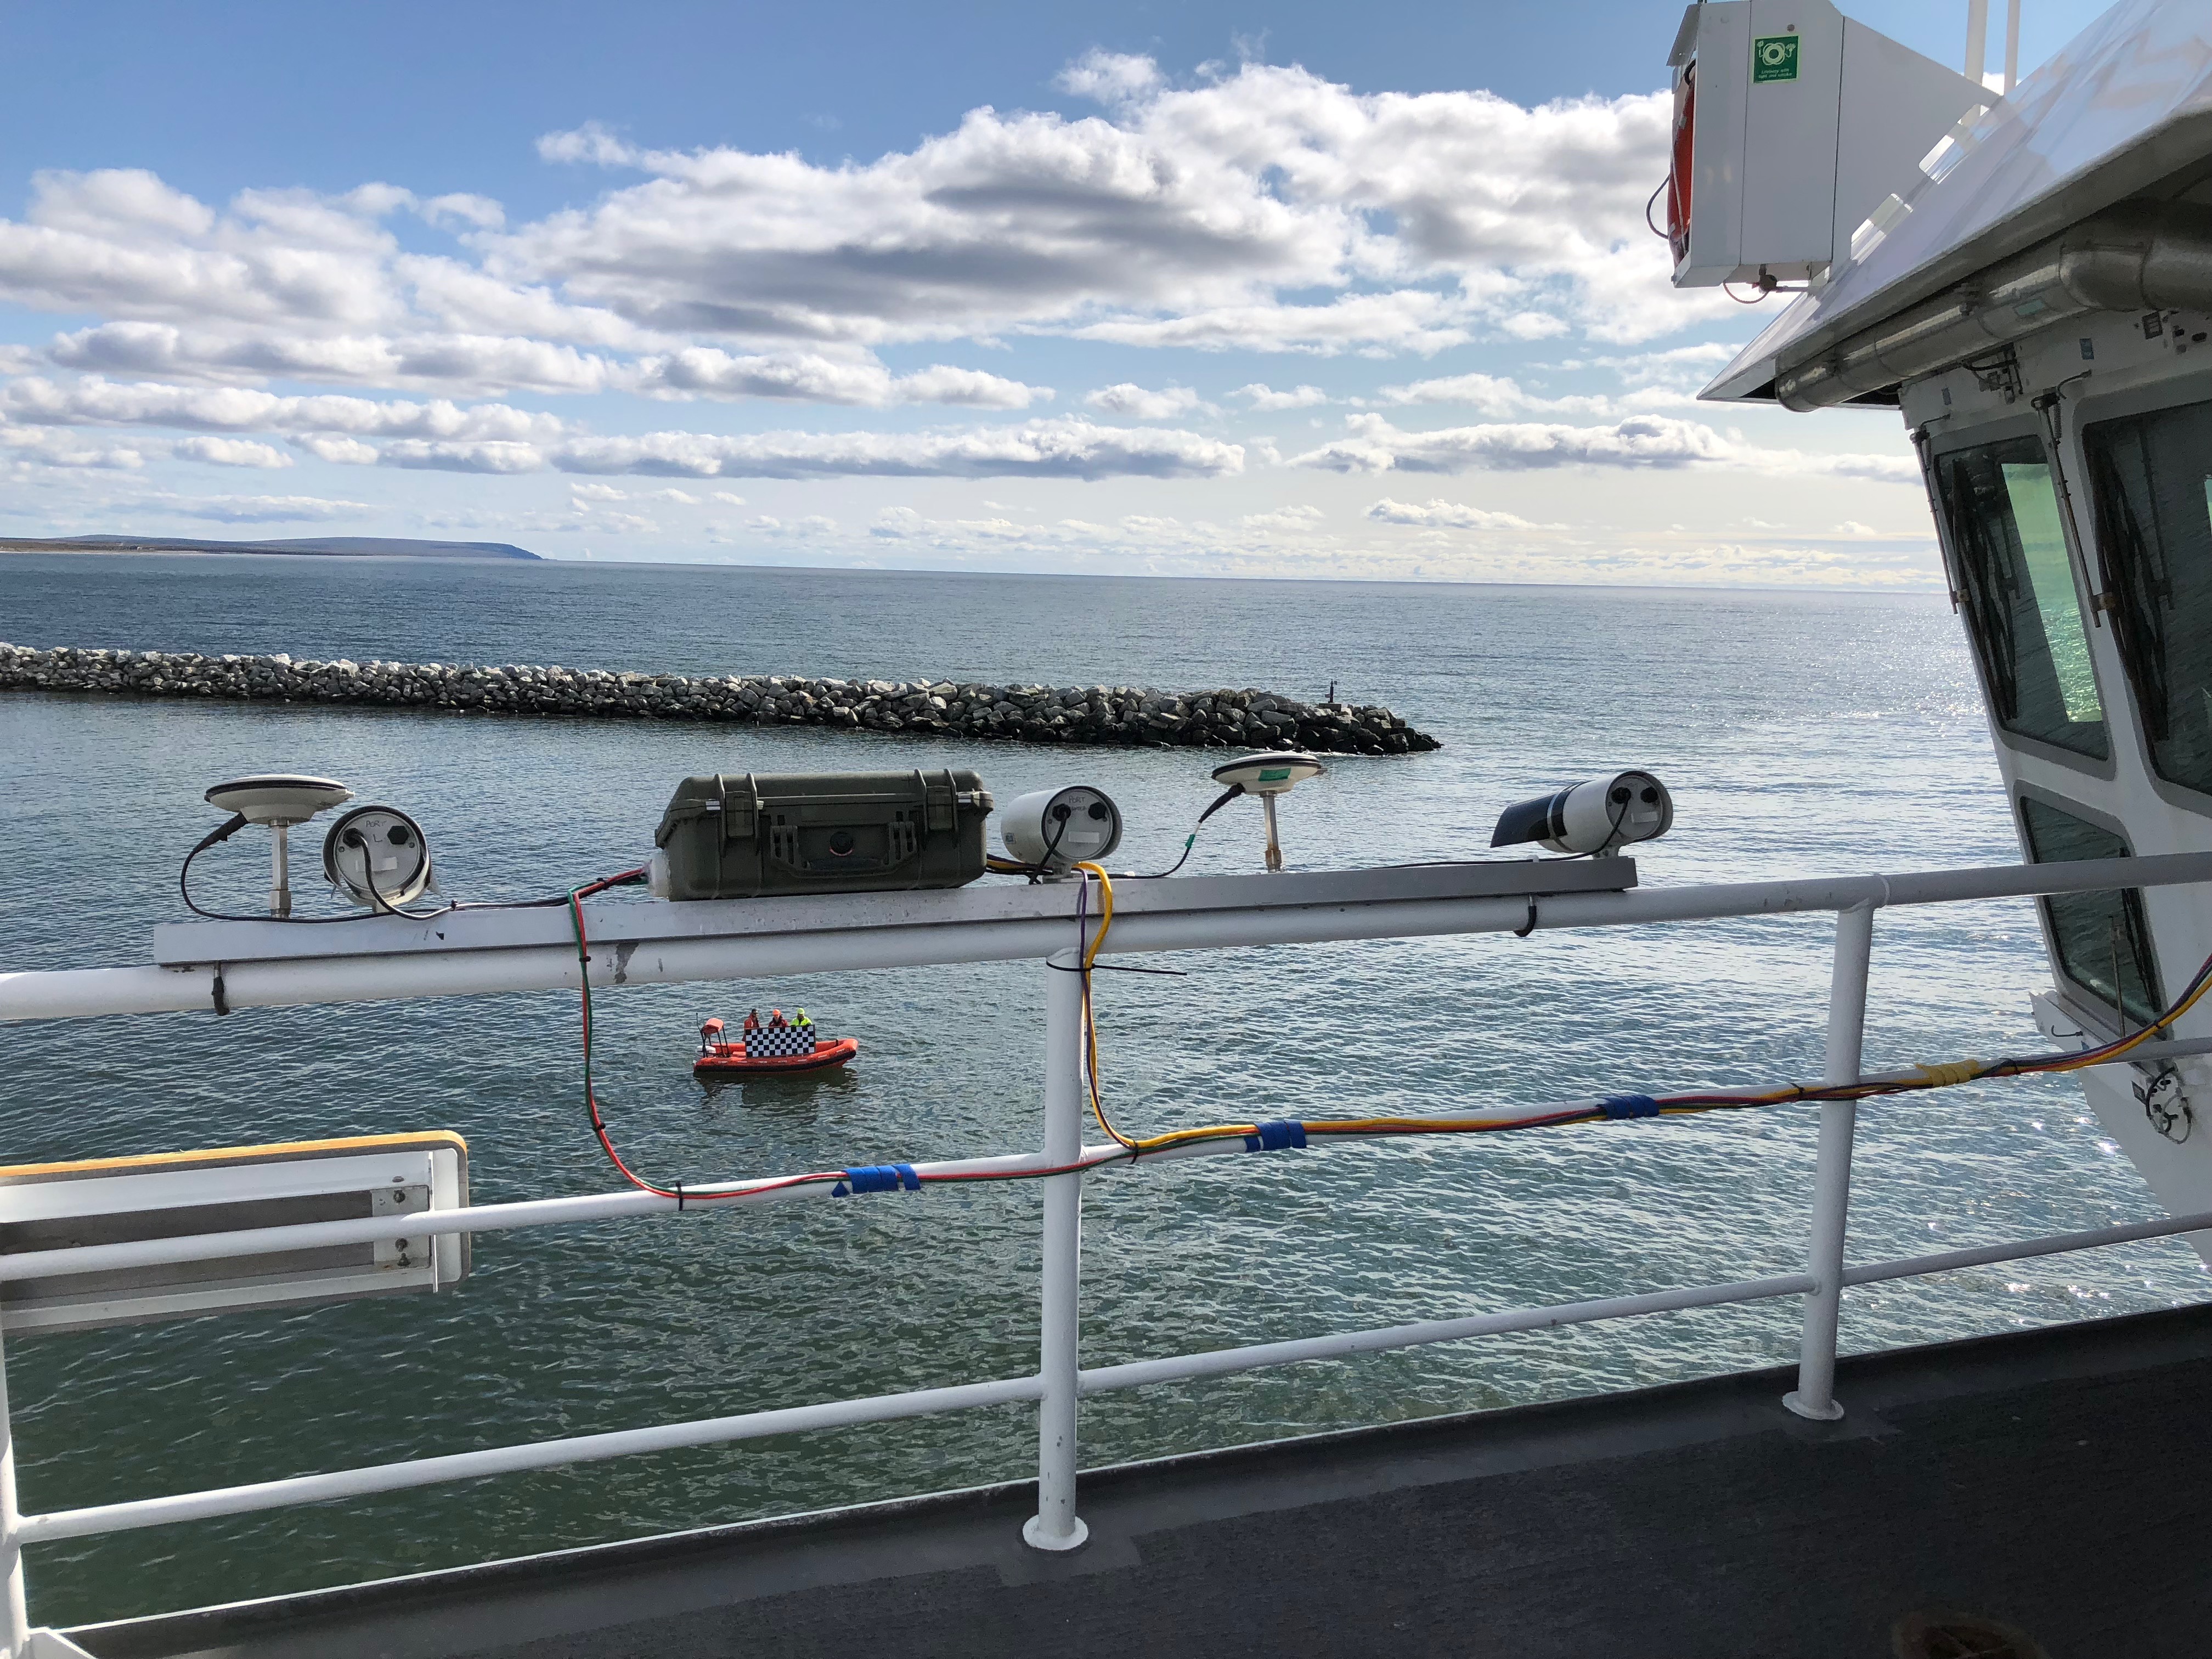
Thomson's group at APL-UW has also installed a stereo camera system for imaging surface waves. Here you can see both the system itself, and UW personnel on the small boat, calibrating it's measuremnts with a high-tech checkerboard pattern. |
|
Map of the environmental conditions in the SODA region, provided by the National Ice Center. |
|
Background |
Seasonal Influences |
|
|
Water mass exchange between the Arctic and subpolar Atlantic and Pacific oceans (and the inputs of shelf waters along the perimeter of the deep basin), and the local momentum and buoyancy transfers between the atmosphere, ice, and upper ocean govern Arctic Ocean stratification and circulation. The primary sources for arctic water masses are the saline water from the Atlantic (S~35) entering through Fram Strait and the shallower seas to its east, fresher seawater from the Pacific (S~32) entering through Bering Strait, freshwater runoff, predominately from the large Eurasian rivers, and a net positive precipitation minus evaporation (P–E). Among the most prominent features of the present-day Arctic is the amplified seasonality of sea ice extent that exposes vast regions to a broad range of ice conditions over an annual cycle. The physical processes that govern the coupled atmosphere–ice–ocean system evolve with this annual cycle in ice cover and sea ice properties. The combination of ice cover, which modulates momentum and buoyancy transfer between the atmosphere and upper ocean, and the strong vertical density contrast created by the fresh mixed layer and cold halocline, inhibit the processes that drive diapycnal mixing. Subsurface water mass modification thus occurs slowly along circulation pathways, and arctic sea ice has been largely insulated from subsurface heat carried within the Atlantic and Pacific inflows. But near the surface, variability in sea ice properties imprints onto upper ocean structure by providing a time-varying buoyancy source (fresh water and brine) and by modulating the coupling between the atmosphere and ocean (momentum and heat). Changes in the efficiency of air–sea momentum and heat transfer will drive changes in the processes that govern lateral and vertical exchanges in the water column. More efficient coupling between the atmosphere and upper ocean could enhance entrainment at the mixed layer base and internal wave generation. Given the contrasting water masses present in the upper ocean, enhanced vertical exchanges associated with these processes will impact stratification and circulation. The SODA DRI focuses on how such changes modify the transfer of momentum and buoyancy from the atmosphere into the upper ocean, and their role in governing upper ocean stratification, circulation, and acoustic propagation within the Arctic. |
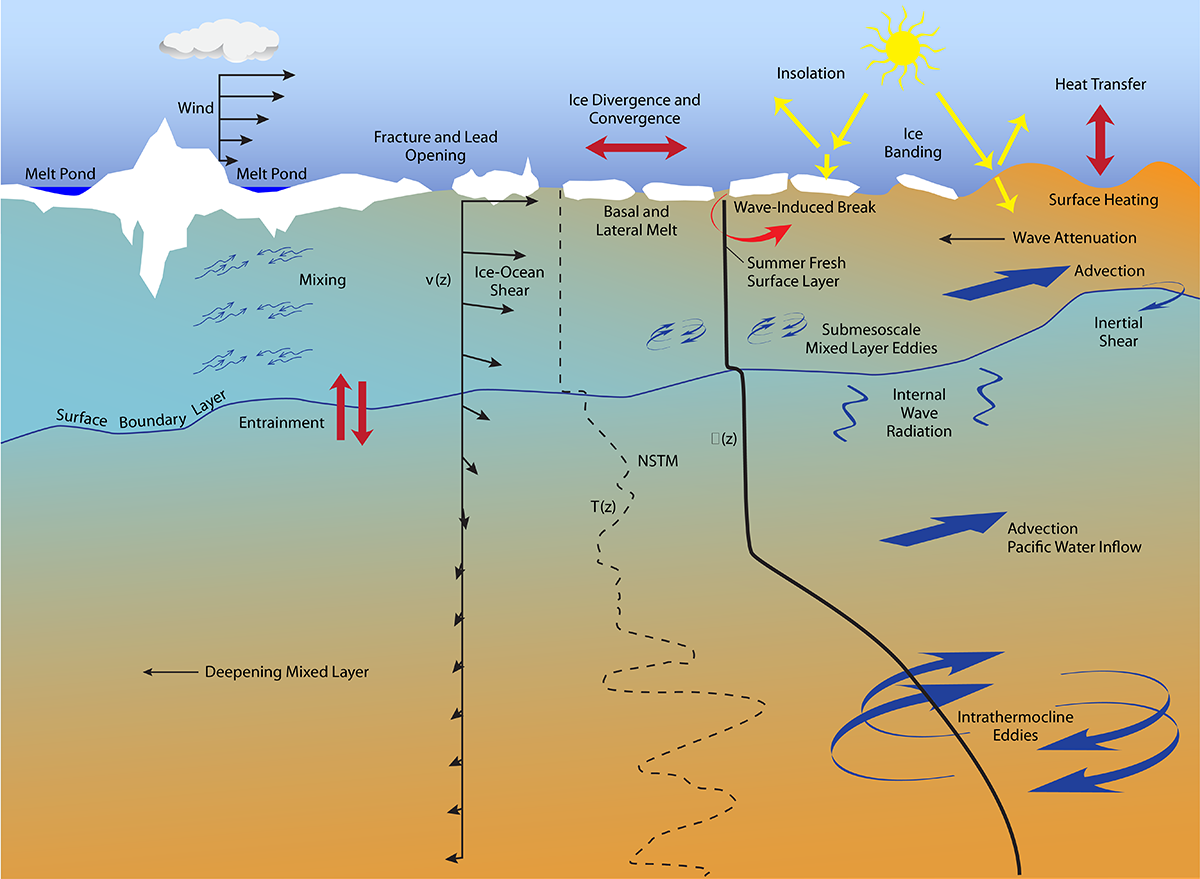
Summer influences driving changes in stratification and circulation of arctic waters. 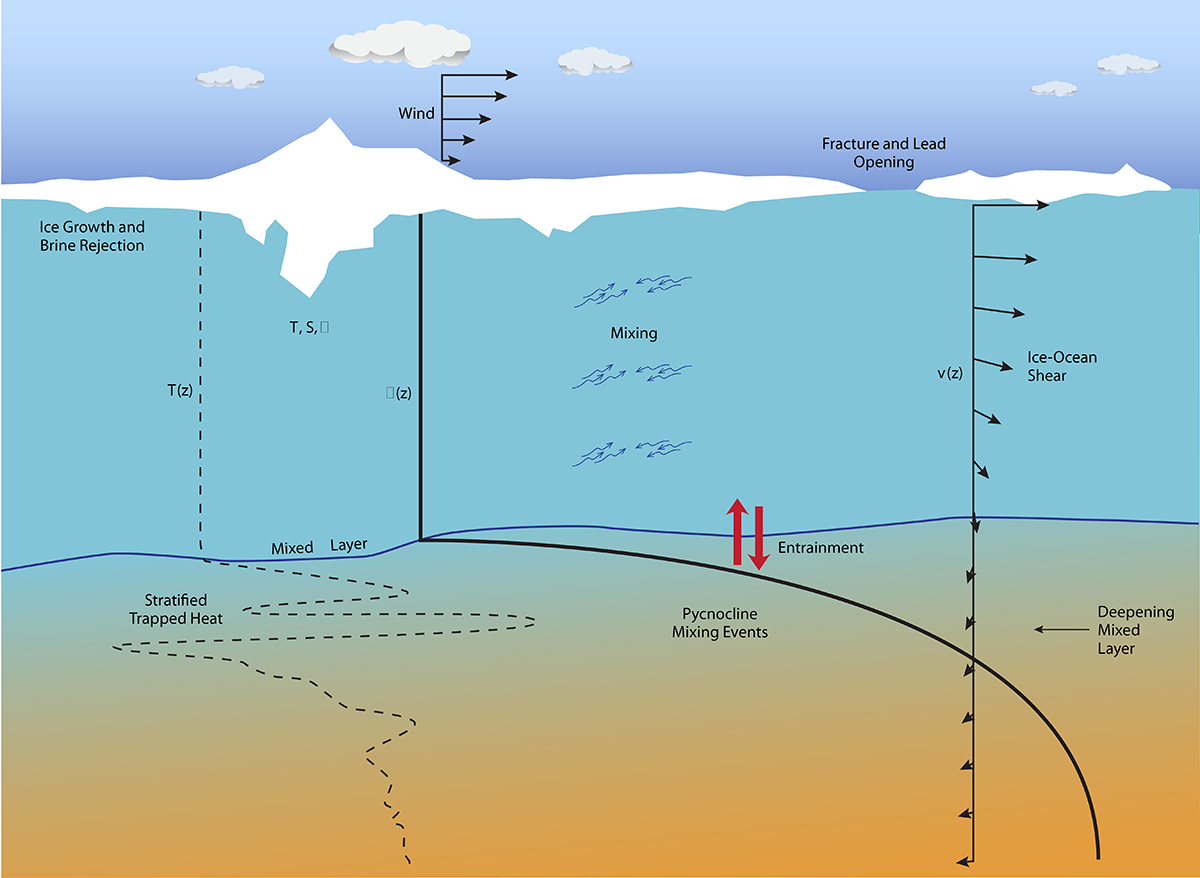
Winter influences driving changes in stratification and circulation of arctic waters. |
|
Advection |
Vertical Fluxes |
|||
|
The surface circulation of the Arctic Ocean is traditionally characterized by the anticyclonic Beaufort Gyre in the west and the Transpolar Drift across the Arctic towards Fram Strait in the east. The Beaufort Gyre, composed mainly of Pacific-derived waters in the upper few hundred meters of the water column, is driven by the time-mean anticyclonic wind stress associated with the Beaufort High in atmospheric pressure. The geostrophic component of the Transpolar Drift is aligned with a watermass front between Atlantic-derived upper ocean waters on the Eurasian side of the Arctic Ocean and Pacific-derived upper ocean waters on the North American side of the Arctic Ocean. At depths of 200–400 m, Atlantic Water circulates cyclonically in boundary currents around the major basins of the Arctic Ocean descending below the fresher, lighter Pacific-derived waters in the Canada Basin. The Beaufort Gyre circulation has an important role in storing the fresh water that is the source of its stratification (Proshutinsky et al., 2002; Proshutinsky et al., 2009). The anticyclonic wind stress of the Beaufort High forces convergence of the Ekman transport of relatively fresh surface water. This domes the surface so as to drive the anticyclonic ocean circulation. From the early to mid 2000s, this doming intensified, the surface layer freshened, and the freshwater storage increased (Farrell et al., 2012; Morison et al., 2012; Proshutinsky et al., 2009). The process has been linked to a shift of basin circulation to an increasingly anticyclonic mode as defined by the Arctic Ocean Oscillation Index (AOOI), equivalent to the sea surface height gradient across the Beaufort Gyre in a barotropic ocean model (Proshutinsky and Johnson, 1997; Proshutinsky et al., 2001). On annual to interannual time scales, atmospheric circulation (e.g., Arctic Oscillation index) plays a large role in controlling storage, redistribution, and export of fresh water in the Arctic (Carmack et al., 2016). The relative distribution of freshwater export between the major exit pathways, through the Canadian Archipelago and Nares Strait or Fram Strait, is unclear. These exits lead to the Greenland and Labrador seas — regions that drive the thermohaline circulation of the world’s oceans. Mesoscale eddies represent another lateral transport mechanism in the ocean. Eddies are believed to derive from instabilities of the larger-scale baroclinic flow field, such as the Beaufort Gyre (e.g., Manucharyan et al., 2016) and transport cores of anomalous water properties over significant distances. Dynamically, lateral down-gradient eddy fluxes likely balance the time-mean wind-driven convergence of low-salinity surface waters of the Beaufort Gyre. Owing to the small Rossby radius of the Arctic, these vorticies are typically quite small, around 10 km diameter (Zhao et al., 2014), but can have remarkably strong azimuthal velocities (several 10s of cm s–1) that may modulate vertical mixing in the upper ocean. Assessment of the eddy inventory in the Canada Basin suggests that there are now more of these features than in the past (Zhao et al., 2016) — a possible consequence of the intensified Beaufort Gyre baroclinicity. On still smaller spatial and temporal scales, submesoscale motions may play a role in upper ocean dynamics in the Arctic (Timmermans et al., 2011). These instability mechanisms act to remove small-scale lateral density gradients in the surface layer, effectively restratifying the upper ocean. When a sea ice cover is present, the surface mixed layer is held close to the local freezing temperature, precluding the development of density compensated temperature–salinity variability often observed in ice-free waters. |
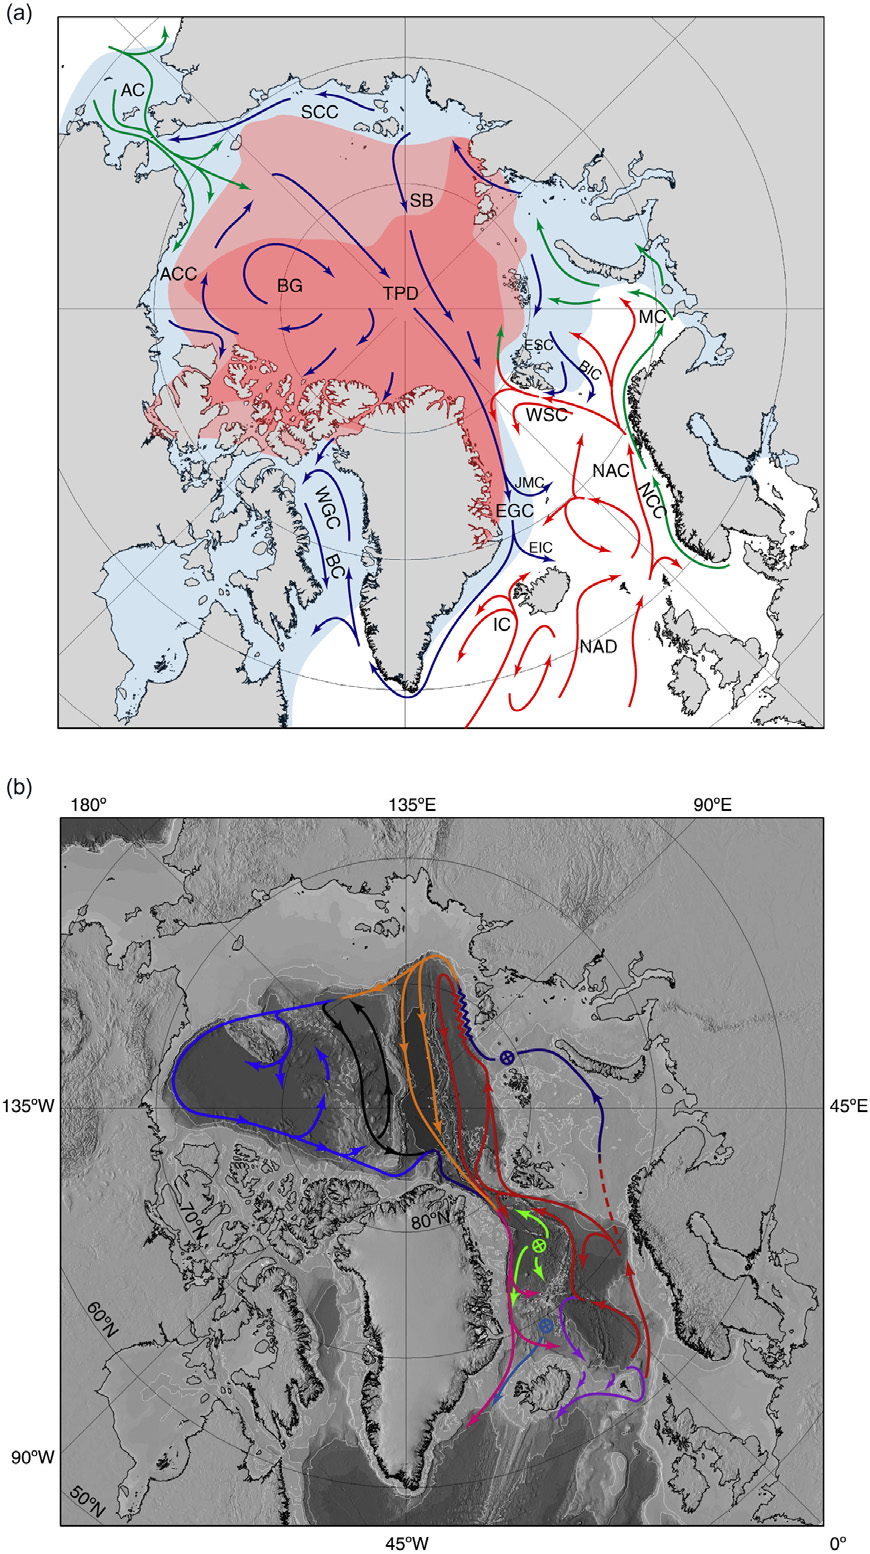
Circulation schematic for the arctic and subarctic seas. (a) The upper ocean. Warm Atlantic currents are indicated by red arrows, cold less saline polar and arctic currents by blue arrows. Low-salinity transformed currents are shown by green arrows. The maximum ice extent is shown in blue and the minimum ice extent in red. The 2007 sea ice minimum is shown in dark red. AC, Anadyr Current; ACC, Alaskan Coastal Current; BC, Baffin Current; BIC, Bear Island Current; BG, Beaufort Gyre; EGS, East Greenland Current; EIC, East Iceland Current; ESC, East Spitsbergen Current; IC, Irminger Current; JMC, Jan Mayen Current; MC, Murman Current; NAD, North Atlantic Drift; NAC, Norwegian Atlantic Current; NCC, Norwegian Coastal Current; SB, Siberian Branch (of the Transpolar Drift); SCC, Siberian Coastal Current; TPD, Transpolar Drift; WGC, West Greenland Current; and WSC, West Spitsbergen Current. From Mauritzen et al. (2013). (b) Intermediate depth ocean. The interactions between the Barents Sea and Fram Strait inflow branches north of the Kara Sea as well as the recirculation and different inflow streams in Fram Strait and the overflows across the Greenland–Scotland Ridge are indicated. From Rudels (2012). |
Vertical heat, salt, and chemical fluxes in the stratified ocean occur principally through turbulent mixing driven by the breakdown of internal wave energy (e.g., Gregg, 1989; Gregg et al., 2003) and double diffusive convection over depths in the halocline where both salinity and temperature increase with depth (e.g., Padman and Dillon, 1987; Timmermans et al., 2008). The latter is manifested by a staircase-like thermohaline stratification consisting of O(1-m) thick layers separated by sharp gradient regions. The vertical temperature and salinity fluxes through these staircase stratifications, effectively set by the molecular diffusion through the staircase gradient regions, are believed to be very small. Similarly, away from regions of strong internal tidal generation, the internal wave field in the Arctic and the associated turbulent mixing is significantly weaker than that at lower latitudes. Away from topographic features, energy levels are typically 1–2 orders of magnitude lower than observed in the mid-latitude open ocean (D'Asaro and Morison, 1992; Levine et al., 1985, 1987). The isolation of the ocean from the atmosphere by sea ice is often cited as inhibiting atmospheric momentum transfer into the Arctic Ocean. This is certainly the case in a rigid, compact ice pack because internal ice stress absorbs some of the atmospheric momentum, but in a looser pack ice can enhance the momentum transfer from the atmosphere into the ocean (Martin et al., 2014; McPhee et al., 1987; Morison et al., 1987). Dissipation in the oscillating boundary layer under the sea ice has been hypothesized as an important sink of internal wave energy in the Arctic Ocean compared to ice-free seas (Morison et al., 1985). It has been suggested that this increased under-ice dissipation causes a much shorter effective energy decay timescale [24 days compared to 100 days in the open ocean based on the Desaubies formulation (Desaubies, 1976) of the Garrett–Munk (GM) internal wave spectra (Garrett and Munk, 1972, 1975)], implying the internal wave field in the Arctic Ocean cannot reach typical saturated GM internal wave energy levels. Acoustic Doppler Current Profiler (ADCP) observations in the Canada Basin (Pinkel, 2005) suggest that most near-inertial internal waves in the Arctic exist in a one-bounce scenario, i.e., that they are generated at the surface, reflect once off the bottom and then dissipate in the under-ice boundary layer (Morison et al., 1985). Despite historic declines in sea ice thickness, extent, and concentration in the Pacific sector of the Arctic Ocean in the past 10 years, a number of observational studies suggest that Arctic Ocean internal wave energy is still low, and it remains unclear how this might change in the future. Internal wave energy levels and inferred mixing measured in the last 10 years with Expendable Current Profilers (XCP) compared with similar observations from the 1980s show little change in internal wave energy and mixing (Guthrie et al., 2013). Strong near-surface stratification associated with the accumulation of fresh water appear to continue to enhance the dissipation of internal wave energy in the under-ice boundary layer (Guthrie et al., 2013). Changes to near-surface stratification on weekly to monthly timescales clearly alter the internal wave field (Cole et al., 2014). Comparisons of internal wave shear measured at identical locations in the Beaufort Sea by the ONR Seasonal Ice Zone Reconnaissance Surveys project show virtually no difference between ice-free and ice-covered conditions, with inferred mixing values consistently O(10–6) m2 s–1. However, internal wave vertical displacement estimates from Canada Basin Ice-Tethered Profiler (ITP) data (Dosser and Rainville, 2015) show a seasonal cycle in near-inertial internal waves that is related to both wind strength and ice characteristics. While the 10-year (2005–2014) time series of ITP estimates shows only a minor increasing trend in mean amplitude, the distribution of internal wave amplitude may be changing. Measurements of mixing under arctic storms (Kawaguchi et al., 2015), and with better time and space resolution (e.g., MIZ and Sea State of the Emerging Arctic Ocean DRIs data), are emerging, which may lead to a better understanding of the integrated impact of internal waves and episodic processes driven by patchy air–ice–ocean fluxes. Unfortunately, it is difficult to capture the fate of near-inertial internal waves in the Arctic Ocean from generation to dissipation, because in the presence of ice cover, concurrent high-resolution fixed point measurements of wind speed, ice drift, and ocean velocities from the surface to depth are difficult to make. |
|
SODA science objectives guide the design of a measurement strategy to: |
|
|
The SODA measurement program builds on advances in autonomous observing from the Marginal Ice Zone DRI to employ a system consisting of four interrelated components (Figure, at right): 1. Drifting observations from ice-based buoys and instruments drifting in the water column, 2. geographically fixed sampling by moorings and gliders, 3. Beaufort Sea inflow observations by floats and Pressure Inverted Echo Sounders (PIES), 4. and a ship-based process study, all of which will be augmented by remote sensing and numerical simulations. 
SODA observing activities. Blue lines mark ice-based observing, gold geographically fixed measurements, green inflow observations, and red-outlined box the process cruise. Other grey boxes mark cruises. |
Complementary observing elements will sample through diverse atmospheric forcing and ice cover regimes, providing a wide dynamic range to address SODA science questions. 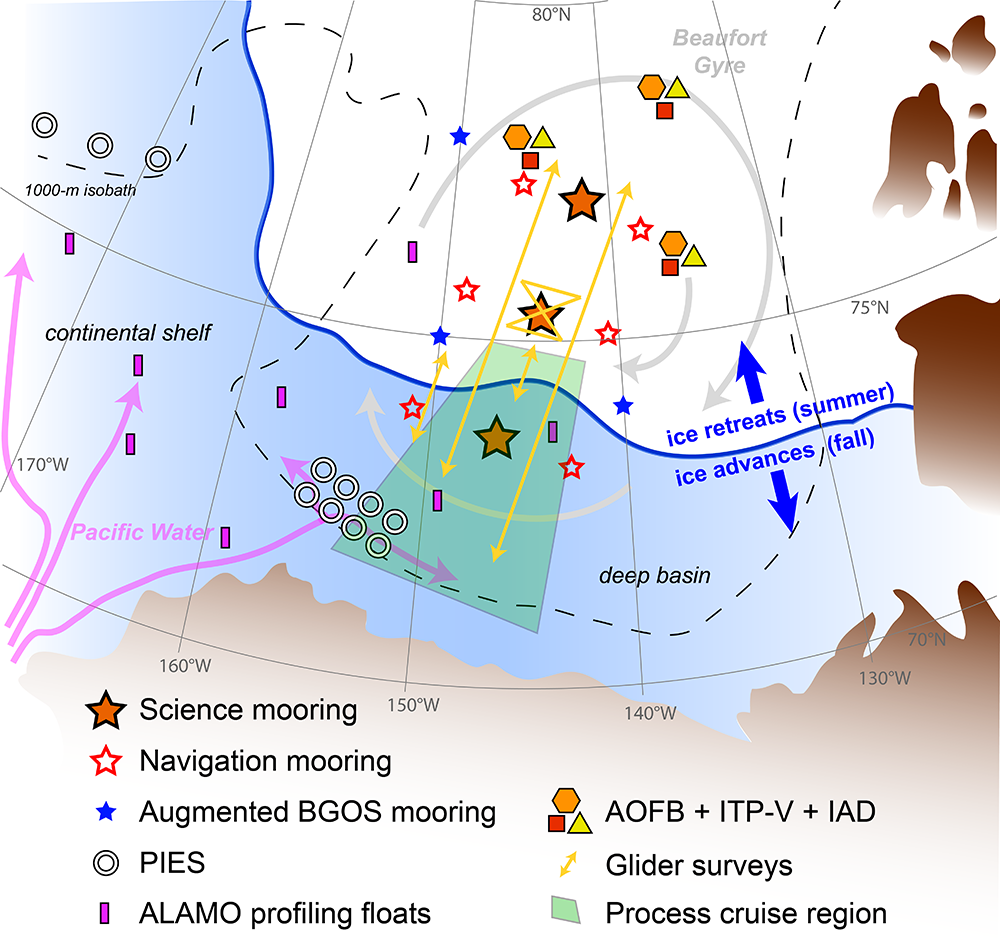
Schematic representation of the SODA observing plan (BGOS, Beaufort Gyre Observing System; PIES, Pressure Inverted Echo Sounder; ALAMO, Air-Launched Autonomous Micro Observer; AOFB, Autonomous Ocean Flux Buoy; ITP-V, Ice Tethered Profiler with Velocity; IAD, Integrated Autonomous Drifter |
|
Moored |
Mobile |
Ship-based |
||
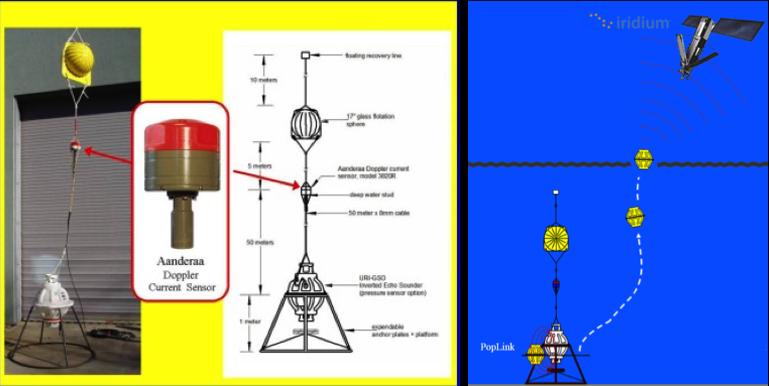
Pressure Inverted Echo Sounder 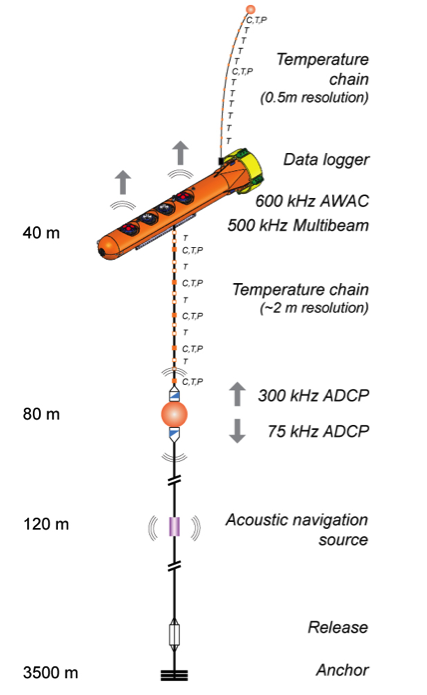
Mooring |
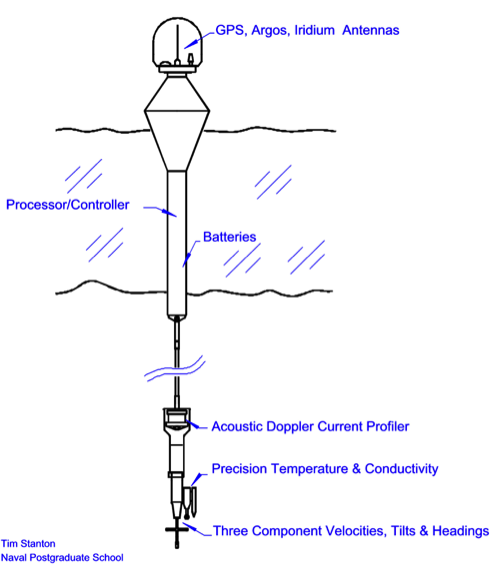
Autonomous Ocean Flux Buoy (AOFB) 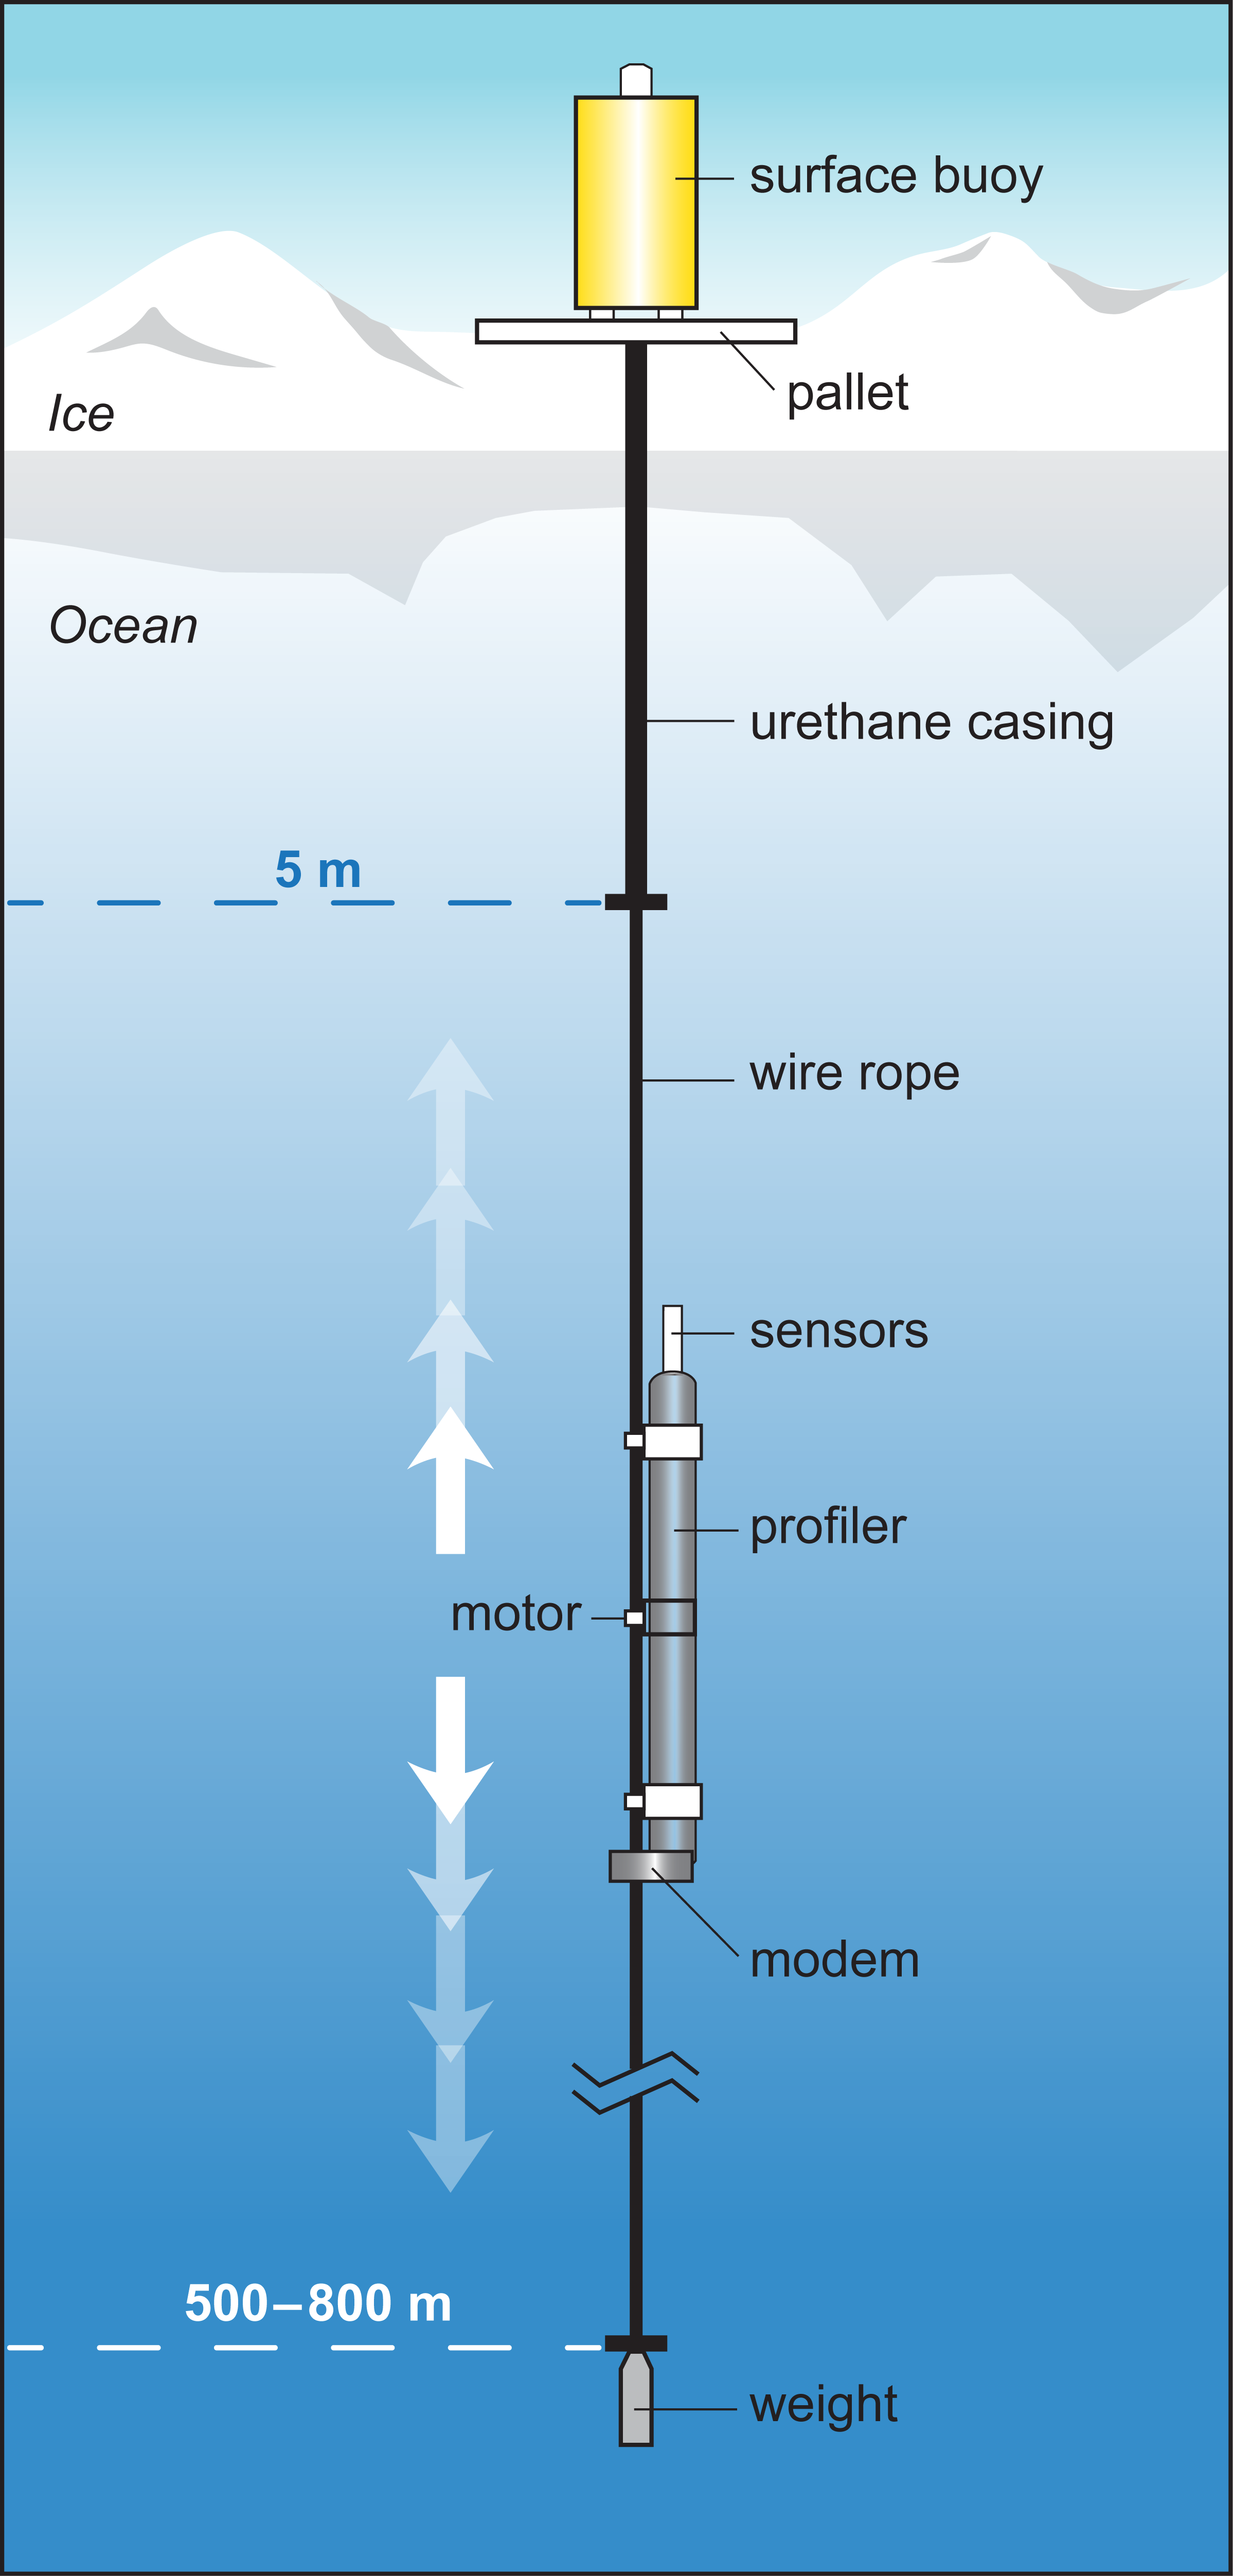
Ice-Tethered Profiler (ITP) 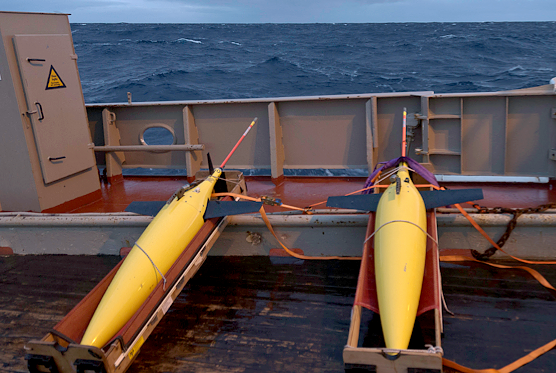
Seagliders await deployment |
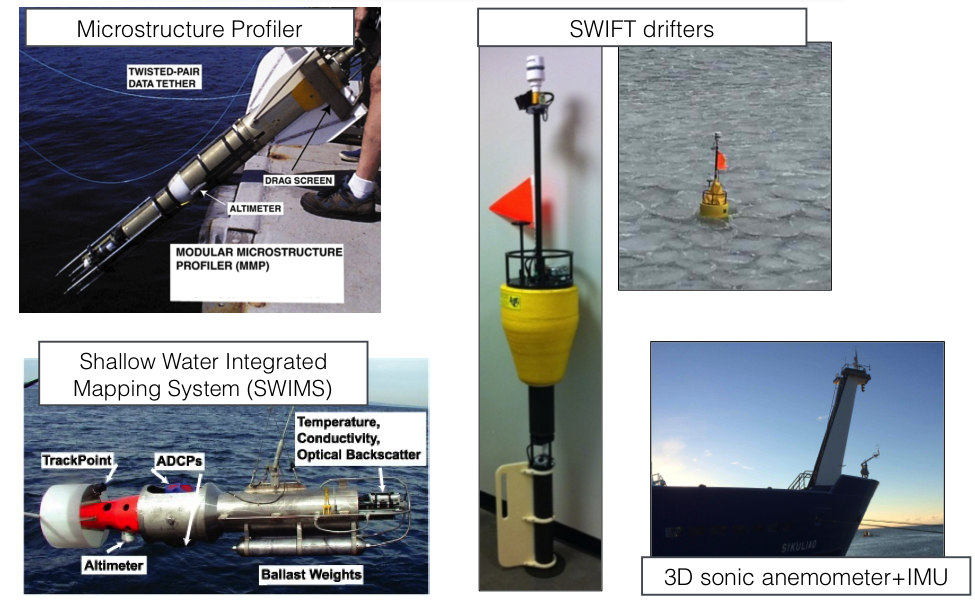
Process Tools |
|
Publications |
|||||||||||||||||||||||||||||||||||||||||||||||||||||||||||||||||||||||||||||||||||||||||||||||||||||||||||||||||||||||||||||||||||||||||||||||||||||||||||||||||||||||||||||
|
|||||||||||||||||||||||||||||||||||||||||||||||||||||||||||||||||||||||||||||||||||||||||||||||||||||||||||||||||||||||||||||||||||||||||||||||||||||||||||||||||||||||||||||
|
Science and Experiment Plan |
|||||||||||||||||||
|
|||||||||||||||||||
|
References |
|
Aagaard, K., L.K. Coachman, and E.C. Carmack, 1981. On the halocline of the Arctic Ocean, Deep Sea Res. A, 28, 529–545. Carmack, E.C., M. Yamamoto-Kawai, T.W.N. Haine, S. Bacon, B.A. Bluhm, C. Lique, H. Melling, I.V. Polyakov, M.-L. Timmermans, and W.J. Williams, 2016. Freshwater and its role in the Arctic Marine System: Sources, disposition, storage, export, and physical and biogeochemical consequences in the Arctic and global oceans, J. Geophys. Res. Biogeosci., 121, 675–717, doi:10.1002/2015JG003140. Cole, S.T., M-L. Timmermans, J.M. Toole, R.A. Krishfield, and F.T. Thwaites, 2014. Ekman veering, internal waves, and turbulence observed under Arctic sea ice, J. Phys. Oceanogr., 44, 1306–1328. D’Asaro, E.A., and J.H. Morison, 1992. Internal waves and mixing in the Arctic Ocean, Deep-Sea Res. A, 39, S459–S484. Desaubies, Y.J.F., 1976. Analytical representation of internal wave spectra, J. Phys. Oceanogr., 6(6), 976–981. Dosser, H.V., and L. Rainville, 2015. Dynamics of the changing near-inertial internal wave field in the Arctic Ocean, J. Phys. Oceanogr,. 46, 395–415. Farrell, S.L., D.C. McAdoo, S.W. Laxon, H.J. Zwally, D. Yi, A. Ridout, and K. Giles, 2012. Mean dynamic topography of the Arctic Ocean, Geophys. Res. Lett., 39(1), L01601. Garrett, C.J., and W.H. Munk, 1972. Space-time scales of internal waves, Geophys. Fluid Dyn., 2, 225–264. Garrett, C.J., and W.H. Munk, 1975. Space-time scales of internal waves: A progress report, J. Geophys. Res., 80, 291–297. Gill, A. E., 1984. On the behavior of internal waves in the wakes of storms, J. Phys. Oceanogr., 14, 1129–1151. Gregg, M.C., 1989. Scaling turbulent dissipation in the thermocline, J. Geophys. Res., 94(C7), 9686–9698. Gregg, M.C., T.B. Sanford, and D.P. Winkel, 2003. Reduced mixing from the breaking of internal waves in equatorial waters, Nature, 422, 513–515. Guthrie, J.D., J.H. Morison, and I. Fer, 2013. Revisiting internal waves and mixing in the Arctic Ocean, J. Geophys. Res., 118(8), 3966–3977. Halle, C., and R. Pinkel, 2003. Internal wave variability in the Beaufort Sea during the winter 1993/1994, J. Geophys. Res., 108, 3210, doi:10.1029/2000JC000703. Jackson, J.M., E.C. Carmack, F.A. McLaughlin, S.E. Allen, and R.G. Ingram, 2010. Identification, characterization, and change of the near surface temperature maximum in the Canada Basin, 1993–2008, J. Geophys. Res., 115, C05021, doi:10.1029/2009JC005265. Kawaguchi, Y., S. Nishino, and J. Inoue, 2015. Fixed-point observation of mixed layer evolution in the seasonally ice-free Chukchi Sea: Turbulent mixing due to gale winds and internal gravity waves, J. Phys. Oceanogr., 45, 836–853. Kwok, R., and D.A. Rothrock, 2009. Decline in Arctic sea ice thickness from submarine and ICESat records: 1958–2008, Geophys. Res. Lett., 36, doi:10.1029/2009GL039035. Levine, M.D., C.A. Paulson, and J.H. Morison, 1985. Internal waves in the Arctic Ocean—comparison with lower-latitude observations, J. Phys. Oceanogr., 15(6), 800–809. Levine, M.D., C.A. Paulson, and J.H. Morison, 1987. Observations of internal gravity—waves under the Arctic pack ice, J. Geophys. Res., 92(C1), 779–782. Manucharyan, G., M. Spall, and A. Thompson, 2016. A theory of the wind-driven Beaufort Gyre variability, J. Phys. Oceanogr., EOR, doi:10.1175/JPO-D-16-0091.1 Martin, T., M. Steele, and J. Zhang, 2014. Seasonality and long-term trend of Arctic Ocean surface stress in a model, J. Geophys. Res., 119, 1723–1738. Martini, K.I., H.L. Simmons, C.A. Stoudt, and J.K. Hutchings, 2014. Near-inertial waves and sea ice in the Beaufort Sea, J. Phys. Oceanogr., 44, 2212–2234. Mauritzen, C., B. Rudels and J. Toole, 2013. The Arctic and Subarctic Oceans/Seas. In Ocean Circulation and Climate 2nd edition, J. Church, S. Griffies, J. Gould, and G. Siedler, eds., 443–464 (Academic Press). McPhee, M.G., G.A. Maykut, and J.H. Morison, 1987. Dynamics and thermodynamics of the ice/upper ocean system in the marginal ice zone of the Greenland Sea, J. Geophys. Res., 92(C7), 6987–7011. Melling, H., and E.L. Lewis, 1982. Shelf drainage flow in the Beaufort Sea and their effects on the Arctic Ocean pycnocline, Deep Sea Res. A, 29, 967–985. Morison, J.H., C.E. Long, and M.D. Levine, 1985. The dissipation of internal wave energy under arctic ice, J. Geophys. Res., 90(C6), 11,959–911,966. Morison, J.H., M.G. McPhee, and G.A. Maykut, 1987. Boundary layer observations in the Greenland Sea marginal ice zone, J. Geophys. Res., 92(C7), 6987–7011. Morison, J.H., R. Kwok, C. Peralta-Ferriz, M. Alkire, I. Rigor, R. Andersen, and M. Steele, 2012. Changing Arctic Ocean freshwater pathways, Nature, 481(7379), 66–70. Overland, J., E. Hanna, I. Hanssen-Bauer, S.-J. Kim, J.E. Walsh, M. Wang, U.S. Bhatt, and R.L. Thoman, 2015. Surface air temperature, in Arctic Report Card (NOAA, see http://www.arctic.noaa.gov/reportcard/air_temperature.html). Padman, L., and T.M. Dillon, 1987. Vertical heat fluxes through the Beaufort Sea thermohaline staircase, J. Geophys. Res., 92(C10), 10799–10806. Perovich, D.K., W. Meier, J. Maslanik, and J. Richter-Menge, 2012. Sea ice cover (in State of the Climate in 2011), Bull. Am. Meteor. Soc., 3, S140–S142. Perovich, D., W. Meier, M, Tschudi, S. Farrell, S. Gerland and S. Hendricks, 2015. Sea ice, in Arctic Report Card (NOAA, http://www.arctic.noaa.gov/reportcard). Pinkel, R., 2005. Near-inertial wave propagation in the western Arctic, J. Phys. Oceanogr., 35(5), 645–665. Plueddemann, A.J., 1992. Internal wave observations from the Arctic environmental drifting buoy, J. Geophys. Res., 97, 12,619–12,638, doi:10.1029/92JC01098. Proshutinsky, A., and M. Johnson, 1997. Two circulation regimes of the wind-driven Arctic Ocean, J. Geophys. Res., 102(C6), 12,493–12,514. Proshutinsky, A., M. Johnson, and T. Proshutinsky, 2001. Understanding climatic controls on sea-ice transport pathways in the Arctic Ocean, Ann. Glaciol., 33, 551–554. Proshutinsky, A., R.H. Bourke, and F.A. McLaughlin, 2002. The role of the Beaufort Gyre in Arctic climate variability: Seasonal to decadal climate scales, Geophys. Res. Lett., 29(23), doi: 10.1029/2002GL015847. Proshutinsky, A., R. Krishfield, M. L. Timmermans, J. Toole, E. Carmack, F. McLaughlin, W. J. Williams, S. Zimmermann, M. Itoh, and K. Shimada, 2009. Beaufort Gyre freshwater reservoir: State and variability from observations, J. Geophys. Res., 114, doi: 10.1029/2008JC005104. Rainville, L., and P. Winsor, 2008. Mixing across the Arctic Ocean: Microstructure observations during the Beringia 2005 Expedition, Geophys. Res. Lett., 35, L08606, doi:10.1029/2008GL033532. Rudels, B., L.G. Anderson, and E.P. Jones, 1996. Formation and evolution of the surface mixed layer and the halocline of the Arctic Ocean, J. Geophys. Res., 101, 8807–8821. Rudels, B., 2012. Arctic Ocean circulation and variability—advection and external forcing encounter constraints and local processes, Ocean Sci. 8, 261–286. Schweiger, A., R. Lindsay, J. Zhang, M. Steele, H. Stern, and R. Kwok, 2011. Uncertainty in modeled Arctic sea ice volume, J. Geophys. Res., 116, doi:10.1029/2011JC007084. Serreze, M.C., and C.M. Hurst, 2000. Representation of mean Arctic precipitation from NCEP-NCAR and ERA reanalyses, J. Clim., 13(1), 182–201. Serreze, M.C., A.P. Barrett, A.G. Slater, R.A. Woodgate, K. Aagaard, R. Lammers, M. Steele, R. Moritz, M. Meredith, and C.M. Lee, 2006. The large-scale freshwater cycle of the Arctic, J. Geophys. Res., 111, C11010. Shaw, W.J., T.P. Stanton, M.G. McPhee, J.H. Morison, and D.G. Martinson, 2009. The role of the upper ocean in the surface heat budget of the Arctic Ocean, J. Geophys. Res., 114, doi: 10.1029/2008JC004991. Steele, M., J. Morison, W. Ermold, I. Rigor, M. Ortmeyer, and K. Shimada, 2004. Circulation of summer Pacific halocline water in the Arctic Ocean, J. Geophys. Res., 109, C02027, doi:10.1029/2003JC002009. Thomson, J., Y. Fan, S. Stammerjohn, J. Stopa, W.E. Rogers, F. Girard-Ardhuin, F. Ardhuin, H. Shen, W. Perrie, H. Shen, S. Ackley, A. Babanin, Q. Liu, P. Guest, T. Maksym, P. Wadhams, C. Fairall, O. Persson, M. Doble, H. Graber, B. Lund, V. Squire, J. Gemmrich, S. Lehner, B. Holt, M. Meylan, J. Brozena, and J.-R. Bidlot, 2016. Emerging trends in the sea state of the Beaufort and Chukchi Seas, Ocean Model., 105, 1–12, doi:10.1016/j.ocemod.2016.02.009, 2016. Timmermans, M.-L., J. Toole, R. Krishfield, and P. Winsor, 2008. Ice-Tethered Profiler observations of the double diffusive staircase in the Canada Basin thermocline, J. Geophys. Res., 113, C00A02, doi:10.1029/2008JC004829. Timmermans,M.-L., S.T. Cole, and J.M. Toole, 2011. Horizontal density structure and restratification of the Arctic ocean surface layer, J. Phys. Oceanogr., 42, 659–668, doi: 10.1175/JPO-D-11-0125.1 Timmermans, M.-L., A. Proshutinsky, E. Golubeva, J. M. Jackson, R. Krishfield, M. McCall, G. Platov, J. Toole, W. Williams, T. Kikuchi, and S. Nishino, 2014. Mechanisms of Pacific Summer Water variability in the Arctic’s Central Canada Basin, J. Geophys. Res., 119, 7523–7548, doi:10.1002/2014JC010273. Zervakis, V., and M. Levine, 1995. Near-inertial energy propagation from the mixed layer: Theoretical considerations, J. Phys. Oceanogr., 25, 2872–2289. Zhao, M., M.-L. Timmermans, S. Cole, R. Krishfield, A. Proshutinsky, and J. Toole, 2014. Characterizing the eddy field in the Arctic Ocean halocline, J. Geophys. Res., 119, doi:10.1002/2014JC010488. Zhao, M., M.-L. Timmermans, S. Cole, R. Krishfield and J. Toole, 2016. Evolution of the eddy field in the Arctic Ocean's Canada Basin, 2005–2015, Geophys. Res. Lett., 43, 8106–8114. |


