|
|
Sea State and Boundary Layer Physics of the Emerging Arctic Ocean
Office of Naval Research Departmental Research Initiative
|
The Emerging Arctic Ocean
|
|
|
|
|
|
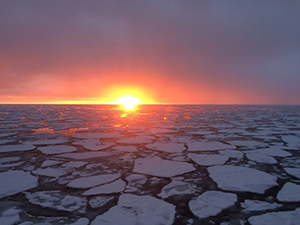
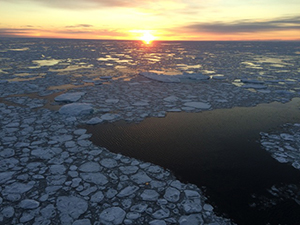
When we talk about the emerging Arctic Ocean we are talking about more open water and less sea ice during summer. Waves have a larger role to play.
When the ice begins to regrow and advance southward in fall, what are the effects of storms and waves?
|
|
Sea State Cruise Animation
|
|
Field Campaign Data Set
|
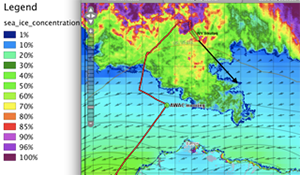
This animation by Maddie Smith shows the Arctic Sea State research cruise on the R/V Sikuliaq in the autumn of 2015. The circle shows the location of the Sikuliaq, with the ship track remaining behind. Symbols show the locations of autonomous buoys deployed along the way. The blue color scale is ice concentration, and the white arrows indicate the wave magnitude and direction.
The counter at the bottom shows the number of satellite images acquired to aid in day-to-day planning during the cruise, as well as for context in data processing.
|
|
|
Arctic Sea State 2015 Field Campaign, Version 1
National Snow & Ice Data Center |
|
 |
Data collection took place under four sampling modes: wave experiments, ice stations, flux stations, and ship surveys. This data set provides curated data from this field campaign in NetCDF data files.
|
|
Latest Insights
|
|
Witness the Arctic, Results + Highlights from the Sea State Program
Jim Thomson contributes a program overview and resource guide to the ARCUS (Arctic Consortium of the United States) Community Highlights online publication. |
|
 |
 |
|
The balance of ice, waves, and winds in the Arctic autumn EOS Earth & Space Science News, Jim Thomson, Stephen Ackley, Hayley Shen, and Erick Rogers Although summer sea ice loss in the Arctic is well studied, less is known about how ice comes back in autumn. A new program, Sea State and Boundary Layer Physics in the Emerging Arctic Ocean, is changing that. |
|
23 Jan 2017 
|
|
 |
 |
|
Emerging trends in the sea state of the Beaufort and Chukchi seas Thomson, J., et al., "Emerging trends in the sea state of the Beaufort and Chukchi seas," Ocean Modell., 105, doi:10.1016/j.ocemod.2016.02.009, 2016. |
|
More Info
| |
|
1 Sep 2016 
|
|
 |
|
|
The sea state of the Beaufort and Chukchi seas is controlled by the wind forcing and the amount of ice-free water available to generate surface waves. Clear trends in the annual duration of the open water season and in the extent of the seasonal sea ice minimum suggest that the sea state should be increasing, independent of changes in the wind forcing. Wave model hindcasts from four selected years spanning recent conditions are consistent with this expectation. In particular, larger waves are more common in years with less summer sea ice and/or a longer open water season, and peak wave periods are generally longer. The increase in wave energy may affect both the coastal zones and the remaining summer ice pack, as well as delay the autumn ice-edge advance. However, trends in the amount of wave energy impinging on the ice-edge are inconclusive, and the associated processes, especially in the autumn period of new ice formation, have yet to be well-described by in situ observations. There is an implicit trend and evidence for increasing wave energy along the coast of northern Alaska, and this coastal signal is corroborated by satellite altimeter estimates of wave energy.
|
|
 |
|
Wind and wave influences on sea ice floe size and leads in the Beaufort and Chukchi seas during the summer-fall transition 2014 Wang, Y., B. Holt, W.E. Rogers, J. Thomson, and H.H. Shen, "Wind and wave influences on sea ice floe size and leads in the Beaufort and Chukchi seas during the summer-fall transition 2014," J. Geophys. Res., 121, 1502-1525, doi:10.1002/2015JC011349, 2016. |
|
More Info
| |
|
20 Feb 2016 
|
|
 |
|
|
Sea ice floe size distribution and lead properties in the Beaufort and Chukchi Seas are studied in the summer-fall transition 2014 to examine the impact on the sea ice cover from storms and surface waves. Floe size distributions are analyzed from MEDEA, Landsat8, and RADARSAT-2 imagery, with a resolution span of 1–100 m. Landsat8 imagery is also used to identify the orientation and spacing of leads. The study period centers around three large wave events during August–September 2014 identified by SWIFT buoys and WAVEWATCH III model data. The range of floe sizes from different resolutions provides the overall distribution across a wide range of ice properties and estimated thickness. All cumulative floe size distribution curves show a gradual bending toward shallower slopes for smaller floe sizes. The overall slopes in the cumulative floe size distribution curves from Landsat8 images are lower than, while those from RADARSAT-2 are similar to, previously reported results in the same region and seasonal period. The MEDEA floe size distributions appeared to be sensitive to the passage of storms. Lead orientations, regardless of length, correlate slightly better with the peak wave direction than with the mean wave direction. Their correlation with the geostrophic wind is stronger than with the surface wind. The spacing between shorter leads correlates well with the local incoming surface wavelengths, obtained from the model peak wave frequency. The information derived shows promise for a coordinated multisensor study of storm effects in the Arctic marginal ice zone.
|
|
|
Drone Checks Arctic Ice Loss
By Andy Stiny, Monterey Herald, 16 January 2016
Coverage of Peter Guest's meteorological observations with a flying drone during the fall 2015 Arctic Sea State cruise |
|
 |
|
|
DRI Description
|
|
Goals
|
|
|
In response to the observed decline in Arctic sea ice extent, the U.S. Navy has a renewed interest in understanding and predicting the environment in this region, including a desire to forecast the presence or absence of sea ice at a variety of lead times. However, there remain fundamental gaps in our knowledge of the physical environment and processes, interactions and feedbacks that are critical to understanding the seasonal evolution of sea ice and the effect of increasing open water on the ice and on the atmosphere, at the Arctic to hemispheric scale. To address this issue, the ONR Arctic and Global Prediction Program will support a 5-year Department Research Initiative (DRI) to better understand the sea state and boundary layer physics of the emerging Arctic Ocean, particularly in the Beaufort and Chukchi seas.
|
|
- Develop a sea state climatology, identify factors affecting the spatial and temporal variability of sea state, and improve forecasting of waves on the open ocean and in the marginal ice zone
- Develop a climatology of and improve theory of wave attenuation/scattering in the sea ice cover
- Use wave scattering theory directly in integrated Arctic system models, and indirectly to define an ice rheology for use in Arctic system models
- Understand the physics of heat and mass transfer from the ocean to the atmosphere, and the seasonal variability of fluxes during summer ice retreat and autumn ice advance
|
|
|
|
Timeline
|
|
Program Contact
|
The DRI is expected to run for five years, from FY13 to FY17. Years 1 and 2 will focus on science and experiment planning, science team building, developing inter-agency and international collaboration, and equipment development and testing. The major field effort will occur in Year 3 (FY15), followed by two years of data analysis and synthesis of results. The overall effort will require integration of theory, in situ and remote sensing observations, and modeling to accelerate discovery and understanding. The DRI is an ONR contribution to SEARCH, the federal inter-agency Study of Environmental Arctic Change.
|
|
Dr. Martin Jeffries
Program Officer and Science Advisor
Office of Naval Research, Code 32
875 N. Randolph Street
Arlington, VA 22203
martin.jeffries@navy.mil
|
|
Updates from the Field
|
|
|
We have finished our last measurements and are now in transit to Dutch Harbor, where we will disembark the ship. We amassed quite a dataset, and we will spend the next several years working together to understand the autumn ice advance and the role of waves in the Arctic Ocean. By the numbers, we have collected:
- 32 days (559 hours) of visual ice observations
- 228423 ice camera images
- 467 physical ice samples
- 4292 casts of the underway CTD (Conductivity, Temperature, Depth)
- 478 hours of flux measurements from the meteorological mast
- 35 days of wave and ice measurements from the ship’s Rutter radar (2,325,000 images)
- 153 weather balloon (radiosonde) launches
- 12 ice stations
- 7 wave experiments
|
|
|
|
|
|
|
2 November 2015
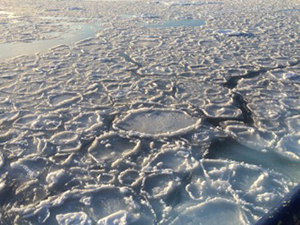
The swell that just rolled through from the Chukchi Sea has really changed the ice edge. The new seasonal ice that was advancing southward in large sheets has broken into smaller floes. Once again, pancake ice is all around us. We had a total of 10 buoys deployed to measure this wave event, which we just chased down and recovered yesterday.
Now, we are spending the last few days here at a series of stations where we can see the refreezing process. It's cold, –12 F with the wind chill, and it appears the ice will be back on the march fast.
|
|
|
|
|
|
|
30 October 2015
The waves have had their time up here, and now, in the final score, the ice is winning. In the month that we have been here, the ice cover has expanded dramatically (see comparison of color maps of ice percentages). We are in the final phase of the project, measuring the ice as it expands and thickens throughout the region.
One more set of waves is in the forecast, and we are setting up for wave measurements at the ice edge over the next few days. These waves may push the edge back, and it may cause some mixing with the warm waters below the surface, but the effects likely will be temporary. It's becoming clear that the waves will be chasing us out of here when we begin our transit south next week.
|
|
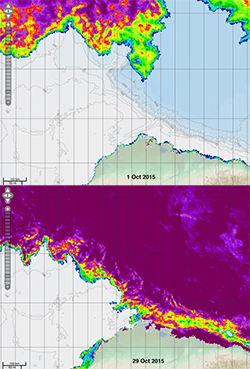
Top: 1 October; bottom: 29 October
|
|
|
|
|
26 October 2015
We have been at the ice edge for several days now, measuring the waves rolling in and the winds pushing the ice around. The ice edge has been persistently holding position right at the shelf break, where the deep waters of the Beaufort gyre meet the shallow depths of the Chukchi Sea. This is where the heat trapped in the ocean is balancing the rapid loss of heat at the surface.
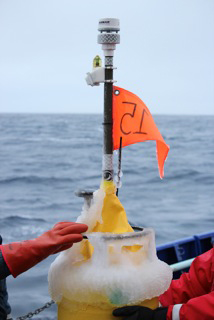
One of our big practical challenges working here is icing. The strong heat loss means that anything placed at the ocean surface will rapidly accumulate ice. Eventually, that ice covers the antennas of buoys — then transmissions become intermittent and the buoys become very hard to track. So far, we have done well locating and recovering buoys, but it's always a race against the ice.
|
|
|
|
|
|
|
20 October 2015
We are now farther north, in a region of flat new ice. The ice has been able to form in large sheets because waves have not penetrated this region. This is in contrast to the pancake ice we have seen before. Some of the sheets are starting to push together and form little ridges, which we are now mapping from below with an underwater vehicle and from above with a laser scanner.
Waves are in the forecast for later this week, so we will head back out to the ice edge and see how the next round goes.
|
|
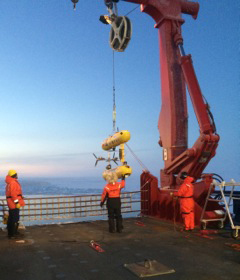
Deployment of an Autonomous Underwater Vehicle (AUV) operated by the team from the Woods Hole Oceanographic Institution
|
|
|
|
|
15 October 2015
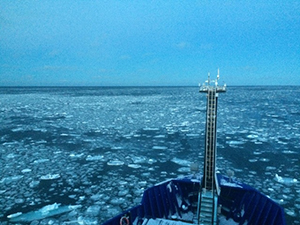
We have been transiting through the ice pack and surveying the effects of the waves. Pancake ice is everywhere, but new ice is already filling in between the pancakes. Refreezing is occurring rapidly. Much of this has to do with the radiation balance, which is changing as the days get shorter and shorter. Today is cold and clear, and the sun did not emerge until 10:15 ADT. That sun won't be up for long, and tomorrow it will be even less.
As we measure the ice "in situ," our colleagues are measuring it remotely. Today we have an aircraft survey above us by a team from the Naval Research Lab. We also have satellite observations several times per day. These measurements give us spatial context for what we are observing from the ship.
|
|
|
|
|
|
|
12 October 2015
Keeping Score in the Arctic: Waves = 1, Ice = 0
The storm we have been measuring has just peaked at 5-m waves and 35-kt winds. We deployed a total of 14 buoys spanning almost 200 km. As the storm built, the whole region was covered in pancake ice — an ice formation pattern that is common when waves are present. As we re-surveyed the line this morning, the pancakes are gone. Much of the region is open water now, suggesting that the wave energy exceeded a threshold for pancake ice and mixed the newly forming ice away instead. Even early in the storm, we can see this process in this short video clip: the wind and waves are creating patches of open water amongst the pancake ice. As the storm went on, the open water patches grew. For now, the waves have won. But the ice will be back. The daylight is decreasing 15 minutes every day here, and the air temperature is well below freezing. Eventually, the ice will have the last word, and winter will arrive in the Arctic.
|
|
|
|
|
|
|
10 October 2015
The buoys are deployed are we are waiting for the waves to build. That should happen later today, according to our on-board forecast team. Small "pancakes" of ice are forming as the waves gently push on the new ice. As the wave energy increases, the pancakes will likely grow bigger... or be wiped out entirely. We shall see in the next few days.
|
|
|
|
|
|
|
|
|
8 October 2015
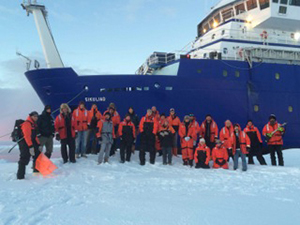
Two ice stations are now complete, and another is soon to follow. The team took a moment for a picture at the first ice station. A storm is in the forecast, with easterly winds that should send waves at the ice advancing from a "peninsula" of ice that survived the summer melt. We plan to transect thru the ice from our present position and arrive there in time to deploy buoys and watch the ice respond to the storm.
|
|
|
|
|
|
|
|
|
7 October 2015
Ice station #1 is underway. We are measuring above, below, and through a large first year floe, with thin new ice nearby. The air is cold and clear, but the ocean below is warm and salty; the dynamics of these two control the balance of the new ice forming all around us.
|
|
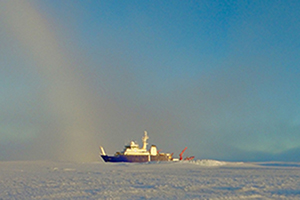
Photo: T. Maksym and G. Williams
|
|
|
|
|
5 October 2015
The Sea State DRI observations are now underway. The R/V Sikuliaq left Nome, AK, on the evening of September 30, and reached the ice on October 4. Along the way, the team deployed a mooring to measure waves, and they tested several wave buoys. Now they are heading into the pack ice to measure the remnant ice from last year and the new ice that is rapidly forming as the month of October brings in the cold and the wind.
|
|
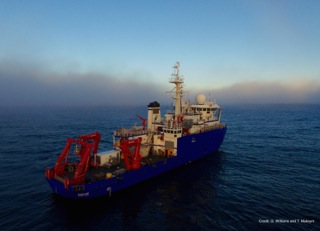
Photo: Guy Williams
|
|
|
|
See all assets in Google Earth
Click to download and open this in your Google Earth client |
|
 |
|
|
Projects and Investigators
|
An Arctic Ice/Ocean Coupled Model with Wave Interactions
Squire, Williams, and Holt
Development of Large-scale Wave Modeling for the Arctic
Rogers and Ardhuin
An Integrative Wave Model in the Marginal Ice Zone Based on a Rheological Parameterization
Shen
Proving and Improving Wave Models in the Arctic Ocean and its MIZ
Wadhams and Doble
Wave Climate and Wave Mixing in the Marginal Ice Zones of Arctic Seas: Observations and Modeling
Babanin
Storm Flux: Heat and Momentum Transfer in the Arctic Air–Sea–Ice System
Thomson
Quantifying the Role of Atmospheric Forcing in Ice Edge Retreat and Advance Including Wind–Wave Coupling
Fairall, Persson, and Guest
Wave–Ice and Air–Ice–Ocean Interaction During the Chukchi Sea Ice Edge Advance
Ackley, Maksym, and Stammerjohn
Radar Remote Sensing of Ice and Sea State and Boundary Layer Physics in the Marginal Ice Zone
Graber
Wave Processes in Arctic Seas Observed from TerraSAR-X
Gemmrich and Lehner
|
|
Science Plan
|
 |
|
Sea State and Boundary Layer Physics of the Emerging Arctic Ocean: Science Plan Thomson, J., et al., "Sea State and Boundary Layer Physics of the Emerging Arctic Ocean: Science Plan," Technical Report, APL-UW TR1306, Applied Physics Laboratory, University of Washington, Seattle, September 2013, 59 pp. |
|
More Info
| |
|
16 Sep 2013 
|
|
 |
|
|
The Office of Naval Research initiated a Department Research Initiative (DRI) titled Sea State and Boundary Layer Physics of the Emerging Arctic Ocean. The central hypothesis of the "Sea State" DRI is that surface waves now have a much greater role in the contemporary Arctic Ocean. Indeed, the entire Arctic Ocean in summer may soon resemble a marginal ice zone (MIZ), where waves propagate through the ice pack and affect the evolution of sea ice over large scales.
The Sea State DRI will use a combination of modeling, in situ observations, and remote sensing to address the following science objectives:
- Develop a sea state climatology for the Arctic Ocean
- Improve wave forecasting in the presence of sea ice
- Improve theory of wave attenuation/scattering in the sea ice cover
- Apply wave–ice interactions directly in integrated arctic system models
- Understand heat and mass fluxes in the air–sea–ice system
The DRI will focus on arctic conditions during the late summer and early autumn, especially the freeze-up of the Beaufort and Chukchi seas, to capture the strongest storms and maximum open water. This focus also complements the Marginal Ice Zone DRI (MIZ-DRI) that is studying the summer breakup and ice retreat. Field observations will be collected primarily during a cruise in the fall of 2015, supplemented by long-term moorings and autonomous platforms.
This Science Plan presents the overall goals and approach of the Sea State DRI. Individual contributions are noted, but the focus is on an integrated vision of the science. Although many of the details will necessarily evolve during the five-year program (2013–2017), it is expected that the priorities defined herein will continue to guide the science that is carried out.
|
|
|
|
Reports
|
|
ONR Sea State DRI Cruise Report: R/V Sikuliaq, Fall 2015 (SKQ201512S) (PDF, 13 MB)
by Jim Thomson, 11 November 2015. |
|
 |
|
A Source Term for Wave Attenuation by Sea Ice in WAVEWATCH III®: IC4
Collins, C.O. III, and W.E. Rogers, Memorandun Report, NRL/MR/7320--17-9726, Naval Research Laboratory, Stennis Space Center, MS, 2017, 32 pp. |
|
 |
|
Forecasting and Hindcasting Waves In and Near the Marginal Ice Zone: Wave Modeling and the ONR 'Sea State' Field Experiment
Rogers, W.E., P. Posey, L. Li, and R.A. Allard, Memorandum Report, NRL/MR/7320-18-9786, Naval Research Laboratory, Stennis Space Center, MS, 2018, 179 pp. |
|
 |
|
|
Special JGR Issue
|
|
Special issue of the Journal of Geophysical Research: Oceans devoted to Sea State and Boundary Layer Physics of the Emerging Arctic Ocean
Surface waves now have a much greater role in the contemporary Arctic Ocean. The specific focus of this issue is on the autumn of 2015, especially the freeze-up of the Beaufort and Chukchi seas, which included strong storms and significant open water. Here, waves propagate through the ice pack and affect the evolution of sea ice over large scales. This large-scale pattern feeds back, as wave generation is controlled by the amount of open water fetch. At smaller scales, waves and ice interact to attenuate and scatter the waves while simultaneously fracturing ice into ever changing floe size and thickness distributions. Further complicating these processes are forcing by winds and surface fluxes from the ocean to the atmosphere, which are modulated by ice cover and orientation relative to the ice edge. The air-sea-ice interactions are complex, with momentum, energy, heat, gas, and moisture fluxes being moderated or produced by the waves, and impacting upper-ocean mixing. |
|
 |
|
BLOG: When life gives you global warming, make pancake ice in ocean wave models
by Nyla Husain, 20 June 2018
This blog discusses the JGR Special Issue paper, Thomson et al., "Overview of the Arctic Sea State and Boundary Layer Physics Program." |
|
 |
|
|
Papers & Presentations
|
 |
|
Wave attenuation through an Arctic marginal ice zone on 12 October 2015: 2. Numerical modeling of waves and associated ice breakup Ardhuin, F., G. Boutin, J. Stopa, F. Girardâ€Ardhuin, C. Melsheimer, J. Thomson, A. Kohout, M. Doble, and P. Wadhams, "Wave attenuation through an Arctic marginal ice zone on 12 October 2015: 2. Numerical modeling of waves and associated ice breakup," J. Geophys. Res., 123, 5652-5668, doi:10.1002/2018JC013784, 2018. |
|
More Info
| |
|
1 Aug 2018 
|
|
 |
|
|
Many processes that affect ocean surface gravity waves in sea ice give rise to attenuation rates that vary with both wave frequency and amplitude. Here we particularly test the possible effects of basal friction, scattering by ice floes, and dissipation in the ice layer due to dislocations, and ice breakup by the waves. The possible influence of these processes is evaluated in the marginal ice zone of the Beaufort Sea, where extensive wave measurements were performed. The wave data includes in situ measurements and the first kilometerâ€scale map of wave heights provided by Sentinelâ€1 SAR imagery on 12 October 2015, up to 400 km into the ice. We find that viscous friction at the base of an ice layer gives a dissipation rate that may be too large near the ice edge, where ice is mostly in the form of pancakes. Further into the ice, where larger floes are present, basal friction is not sufficient to account for the observed attenuation. In both regions, the observed narrow directional wave spectra are consistent with a parameterization that gives a weak effect of wave scattering by ice floes. For this particular event, with a dominant wave period around 10 s, we propose that wave attenuation is caused by ice flexure combined with basal friction that is reduced when the ice layer is not continuous. This combination gives realistic wave heights, associated with a 100–200 km wide region over which the ice is broken by waves, as observed in SAR imagery.
|
|
 |
|
Measuring ocean waves in sea ice using SAR imagery: A quasi-deterministic approach evaluated with Sentinel-1 and in situ data Ardhuin, F., J. Stopa, B. Chapron, F. Collard, M. Smith, J. Thomson, M. Doble, B. Blomquist, O. Persson, C.O. Collins III, and P. Wadhams, "Measuring ocean waves in sea ice using SAR imagery: A quasi-deterministic approach evaluated with Sentinel-1 and in situ data," Remote Sens. Environ., 189, 211-222, doi:10.1016/j.rse.2016.11.024, 2017. |
|
More Info
| |
|
1 Feb 2017 
|
|
 |
|
|
Highlights
• An algorithm is proposed to obtain orbital velocity maps from SAR images over sea ice.
• The algorithm is validated in terms of ocean wave spectra using in situ measurements.
• Wave height retrieval works best in the absence of unresolved short waves.
|
|
|
Ocean waves across the Arctic: Attenuation due to dissipation dominates over scattering for periods longer than 19 s
Ardhuin, F., P. Sutherland, M. Doble, and P. Wadhams, Geophys. Res. Lett., 43, 5775-5783, doi:10.1002/2016GL068204, 2016. |
|
 |
|
Satellite observations of waves in the Arctic Ocean
Babanin, A.V., S. Zieger, and A. Ribal, Proc., 22nd IAHR International Symposium on Ice, 11-15 August, Singapore, 12 pp. (2014). |
|
 |
|
An idealized experimental model of ocean surface wave transmission by an ice floe
Bennetts, L.G., A. Alberello, M.H. Meylan, C. Cavaliere, A.V. Babanin, and A. Toffoli, Ocean Model., 96, 85-92, doi:10.1016/j.ocemod.2015.03.001, 2015. |
|
 |
 |
|
Calibrating a viscoelastic sea ice model for wave propagation in the Arctic fall marginal ice zone Cheng, S., W.E. Rogers, J. Thomson, M. Smith, M.J. Doble, P. Wadhams, A.L. Kohout, B. Lund, O.P.G. Persson, C.O. Collins III, S.F. Ackley, F. Montiel, and H.H. Shen, "Calibrating a viscoelastic sea ice model for wave propagation in the Arctic fall marginal ice zone," J. Geophys. Res., 122, 8770-8793, doi:10.1002/2017JC013275, 2017. |
|
More Info
| |
|
1 Nov 2017 
|
|
 |
|
|
This paper presents a wave-in-ice model calibration study. Data used were collected in the thin ice of the advancing autumn marginal ice zone of the western Arctic Ocean in 2015, where pancake ice was found to be prevalent. Multiple buoys were deployed in seven wave experiments; data from four of these experiments are used in the present study. Wave attenuation coefficients are calculated utilizing wave energy decay between two buoys measuring simultaneously within the ice covered region. Wavenumbers are measured in one of these experiments. Forcing parameters are obtained from simultaneous in-situ and remote sensing observations, as well as forecast/hindcast models. Cases from three wave experiments are used to calibrate a viscoelastic model for wave attenuation/dispersion in ice cover. The calibration is done by minimizing the difference between modeled and measured complex wavenumber, using a multi-objective genetic algorithm. The calibrated results are validated using two methods. One is to directly apply the calibrated viscoelastic parameters to one of the wave experiments not used in the calibration and then compare the attenuation from the model with measured data. The other is to use the calibrated viscoelastic model in WAVEWATCH III over the entire western Beaufort Sea and then compare the wave spectra at two remote sites not used in the calibration. Both validations show reasonable agreement between the model and the measured data. The completed viscoelastic model is believed to be applicable to the fall marginal ice zone dominated by pancake ice.
|
|
 |
|
Doppler correction of wave frequency-spectra measured by underway vessels Collins, C.O., B. Blomquist, O. Persson, B. Lund, W.E. Rogers, J. Thomson, D. Wang, M. Smith, M. Doble, P. Wadhams, A. Kohout, C. Fairall, and H.C. Graber, "Doppler correction of wave frequency-spectra measured by underway vessels," J. Atmos. Ocean. Technol., 34, 429–436, doi:10.1175/JTECH-D-16-0138.1, 2017. |
|
More Info
| |
|
1 Feb 2017 
|
|
 |
|
|
"Sea State and Boundary Layer Physics in the Emerging Arctic Ocean" is an ongoing Departmental Research Initiative sponsored by the Office of Naval Research. The field component took place in the fall of 2015 within the Beaufort and Chukchi Seas and involved the deployment of a number of wave instruments including a downward looking Riegl laser rangefinder mounted on the foremast of the R/V Sikuliaq. Although time series measurements on a stationary vessel are thought to be accurate, an underway vessel introduces a Doppler shift to the observed wave spectrum. This Doppler shift is a function of the wavenumber vector and the velocity vector of the vessel. Of all the possible relative angles between wave direction and vessel heading there are two main scenarios: I) vessel steaming into waves and II) vessel steaming with waves. Previous studies have considered only a subset of cases, and all were in scenario I. This was likely to avoid ambiguities, which arise when the vessel is steaming with waves. This study addresses the ambiguities and analyzes arbitrary cases. In addition, a practical method is provided which is useful in situations when the vessel is changing speed or heading. These methods improved the laser rangefinder estimates of spectral shapes and peak parameters when compared to nearby buoys and a spectral wave model.
|
|
|
An investigation into the dispersion of ocean surface waves in sea ice
Collins, C.O. III, W.E. Rogers, and B. Lund, Ocean Dyn., 67, 263-280, doi:10.1007/s10236-016-1021-4, 2017. |
|
 |
|
On Wave–Ice Interaction in the Arctic Marginal Ice Zone: Dispersion, Attenuation, and Ice Response
Collins, C.O. III, W.E. Rogers, and A. Marchenko, NRL/MR/7320--16-9676, Naval Research Laboratory, Stennis Space Center, MS, February 2016. |
|
 |
|
In situ measurements of an energetic wave event in the Arctic marginal ice zone
Collins, C.O. III, W.E. Rogers, A. Marchenko, and A.V. Babanin, Geophys. Res. Lett., 42, 1863-1870, doi:10.1002/2015GL063063, 2015. |
|
 |
 |
|
On the ocean wave attenuation rate in grease-pancake ice, a comparison of viscous layer propagation models with field data De Santi, F., G. De Carolis, P. Olla, M. Doble, S. Cheng, H.H. Shen, P. Wadhams, and J. Thomson, "On the ocean wave attenuation rate in grease-pancake ice, a comparison of viscous layer propagation models with field data," J. Geophys. Res., 123, 5933-5948, doi:10.1029/2018JC013865, 2018. |
|
More Info
| |
|
1 Aug 2018 
|
|
 |
|
|
The ability of viscous layer models to describe the attenuation of waves propagating in greaseâ€pancake ice covered ocean is investigated. In particular, the Keller's model (Keller, 1998; https://doi.org/10.1029/97JC02966), the twoâ€layer viscous model (De Carolis & Desiderio, 2002; https://doi.org/10.1016/S0375-9601(02)01503-7) and the closeâ€packing model (De Santi & Olla, 2017; arXiv:1512.05631) are extensively validated by using wave attenuation data collected during two different field campaigns (Weddell Sea, Antarctica, April 2000; western Arctic Ocean, autumn 2015). We use these data to inspect the performance of the three models by minimizing the differences between the measured and model wave attenuation; the retrieved ice thickness is then compared with measured data. The three models allow to fit the observation data but with important differences in the three cases. The closeâ€packing model shows good agreement with the data for values of the ice viscosity comparable to those of grease ice in laboratory experiments. For thin ice, the Keller's model performance is similar to that of the closeâ€packing model, while for thick ice much larger values of the ice viscosity are required, which reflects the different ability of the two models to take into account the effect of pancakes. The improvement of performance over the Keller's model achieved by the twoâ€layer viscous model is minimal, which reflects the marginal role in the dynamics of a finite eddy viscosity in the iceâ€free layer. A good ice thickness retrieval can be obtained by considering the ice layer as the only source in the wave dynamics, so that the wind input can be disregarded.
|
|
|
Relating wave attenuation to pancake ice thickness, using field measurements and model results
Doble, M.J., G. De Carolis, M.H. Meylan, and J.-R. Bidlot, Geophys. Res. Lett., 42, 4473-4481, doi:10.1002/2015GL063628, 2015. |
|
 |
|
A comparison of methods for estimating directional spectra of ocean waves
Donelan, M.A., A.V. Babanin, E. Sanina, and D. Chalikov, J. Geophys. Res., 120, 5040-5053, doi:10.1002/2015JC010808, 2015. |
|
 |
|
High resolution sea ice drift estimation using combined TerraSAR-X and RADARSAT-2 data: First tests
Frost, A., S. Jacobsen, and S. Singha, IEEE International Geoscience and Remote Sensing Symposium (IGARSS), Fort Worth, TX, 23-28 July, doi:10.1109/IGARSS.2017.8126966 (IEEE, 2017). |
|
 |
|
Wave observation in the marginal ice zone with the TerraSAR-X satellite
Gebhardt, C., J.-R. Bidlot, J. Gemmrich, S. Lehner, A. Pleskachevsky, and W. Rosenthal, Ocean Dynamics, 66, 839-852, doi:10.1007/s10236-016-0957-8, 2016. |
|
 |
|
The potential of TerraSAR-X to observe wind wave interaction at the ice edge
Gebhardt, C., J.-R. Bidlot, S. Jacobsen, S. Lehner, P.O.G. Persson, and A.L. Pleskachevsky, IEEE J. Sel. Topics Appl. Earth Observ. in Remote Sens., EOR, doi:10.1109/JSTARS.2017.2652124, 2017. |
|
 |
|
Surface waves in Arctic seas, observed from TerraSAR-X
Gemmrich, J., A. Pleskachevsky, S. Lehner, and E. Rogers, IEEE International Geoscience and Remote Sensing Symposium, 26-31 July, Milan, Italy, 3615-3617, doi:10.1109/IGARSS.2015.7326604 (IEEE, 2015). |
|
 |
 |
|
Wave evolution in off-ice wind conditions Gemmrich, J., W.E. Rogers, J. Thomson, S. Lehner, "Wave evolution in off-ice wind conditions," J. Geophys. Res., 123, 5543-5556, doi:10.1029/2018JC013793, 2018. |
|
More Info
| |
|
1 Aug 2018 
|
|
 |
|
|
The reduction of the sea ice coverage increases the importance of wind waves in the Arctic. Updates to the standard spectral wave models in recent years have included many aspects of wave–ice interaction. Here we use highâ€resolution wave parameters retrieved from TerraSARâ€X images and in situ SWIFT buoy observations to evaluate the performance of WAVEWATCH III® in iceâ€free waters in the western Arctic over a 7â€week period including the fall freezeâ€up. About two thirds of the analyzed data sets show a good agreement between observations and model results. In other cases, more accurate representation of the wind input fields and the ice coverage could improve the model predictions. Two data sets with larger discrepancy are discussed in more detail. In these two cases of low model skill, with offâ€ice wind conditions, we show that the model windâ€sea growth is too weak to match TerraSARâ€X observations, and this situation is improved only slightly by including the effects of atmospheric stability using existing methods. Application of an effective fetch parameterization, which allows for reduced wave generation within the marginal ice zone prior to the open ocean, provides the best estimation of wave growth during offâ€ice winds.
|
|
|
Can mineral oil slicks be distinguished from newly formed sea ice using synthetic aperture radar?
Johansson, A.M., M.M. Espeseth, C. Brekke, and B. Holt, IEEE J. Sel. Top. Appl. Earth Obs. Remote Sens., 13, 4996-5010, doi:10.1109/JSTARS.2020.3017278, 2020. |
|
 |
|
Wave heights in the 21st century Arctic Ocean simulated with a regional climate model
Khon, V.C., I.I. Mokhov, F.A. Pogarskiy, A. Babanin, K. Dethloff, A. Rinke, and H. Matthes, Geophys. Res. Lett., 41, 2956-2961, doi:10.1002/2014GL059847, 2014. |
|
 |
|
Comparison of wave propagation through ice covers in calm and storm conditions
Li, J., A.L. Kohout, and H.H. Shen, Geophys. Res. Lett., 42, 5935-5941, doi:10.1002/2015GL064715, 2015. |
|
 |
|
Sensitivity analysis of a viscoelastic parameterization for gravity wave dispersion in ice covered seas
Li, J., S. Mondal, and H.H. Shen, Cold Regions Sci. Technol., 120, 63-75, doi:10.1016/j.coldregions.2015.09.009, 2015. |
|
 |
|
Wind and wave climate in the Arctic Ocean as observed by altimeters
Liu, Q., A.V. Babanin, S. Zieger, I.R. Young, and C. Guan, J. Climate, 29, 7957-7975, doi:10.1175/JCLI-D-16-0219.1, 2016. |
|
 |
 |
|
Arctic sea ice drift measured by shipboard marine radar Lund, B., H.C. Graber, P.O.G. Persson, M. Smith, M. Doble, J. Thomson, and P. Wadhams, "Arctic sea ice drift measured by shipboard marine radar," J. Geophys. Res., 123, 4298-4321, doi:10.1029/2018JC013769, 2018. |
|
More Info
| |
|
1 Jun 2018 
|
|
 |
|
|
This study presents Arctic sea ice drift fields measured by shipboard marine Xâ€band radar (MR). The measurements are based on the maximum cross correlation between two sequential MR backscatter images separated ∼1 min in time, a method that is commonly used to estimate sea ice drift from satellite products. The advantage of MR is that images in close temporal proximity are readily available. A typical MR antenna rotation period is ∼1–2 s, whereas satellite revisit times can be on the order of days. The technique is applied to ∼4 weeks of measurements taken from R/V Sikuliaq in the Beaufort Sea in the fall of 2015. The resulting sea ice velocity fields have ∼500 m and up to ∼5 min resolution, covering a maximum range of ∼4 km. The MR velocity fields are validated using the GPSâ€tracked motion of Surface Wave Instrument Float with Tracking (SWIFT) drifters, wave buoys, and R/V Sikuliaq during ice stations. The comparison between MR and reference sea ice drift measurements yields rootâ€meanâ€square errors from 0.8–5.6 cm s-1. The MR sea ice velocity fields near the ice edge reveal strong horizontal gradients and peak speeds > 1 m s-1. The observed submesoscale sea ice drift processes include an eddy with ∼6 km diameter and vorticities < –2 (normalized by the Coriolis frequency) as well as converging and diverging flow with normalized divergences < –2 and > 1, respectively. The sea ice drift speed correlates only weakly with the wind speed (r2=0.34), which presents a challenge to conventional wisdom.
|
|
 |
|
Attenuation and directional spreading of ocean waves during a storm event in the autumn Beaufort Sea marginal ice zone Montiel, F., V.A. Squire, M. Doble, J. Thomson, and P. Wadhams, "Attenuation and directional spreading of ocean waves during a storm event in the autumn Beaufort Sea marginal ice zone," J. Geophys. Res., 123, 5912-5932, doi:10.1029/2018JC013763, 2018. |
|
More Info
| |
|
1 Aug 2018 
|
|
 |
|
|
This paper investigates the attenuation and directional spreading of large amplitude waves traveling through pancake ice. Directional spectral density is analyzed from in situ wave buoy data collected during a 3â€day storm event in October 2015 in the Beaufort Sea. Two proxy metrics for wave amplitude obtained from energy density spectra, namely, spectral amplitude and significant wave height, are used to track the waves as they propagate along transects through the array of buoys in the predominantly pancake ice field. Two types of wave buoys are used in the analysis and compared, exhibiting significant differences in the wave energy density and directionality estimates. Although exponential decay is observed predominantly, one of the two buoy types indicates a potential positive correlation between wave energy density and the occurrence of linear wave decay, as opposed to exponential decay, in accord with recent observations in the Antarctic marginal ice zone. Factors affecting the validity of this observation are discussed. An empirical power law with exponent 2.2 is also found to hold between the exponential attenuation coefficient and wave frequency. The directional content of the wave spectrum appears to decrease consistently along the wave transects, confirming that wave energy is being dissipated by the pancake ice as opposed to being scattered by ice cakes.
|
|
|
Modelling wave-induced sea ice break-up in the marginal ice zone
Montiel, F., and V.A. Squire, Proc. Roy. Soc. A, 473, 20170258, doi:0.1098/rspa.2017.0258, 2017. |
|
 |
|
Evolution of directional wave spectra through finite regular and randomly perturbed arrays of scatterers
Montiel, F., V.A. Squire, and L.G. Benetts, SIAM J. Appl. Math., 75, 630-651, doi:10.1137/140973906, 2015. |
|
 |
|
Reflection and transmission of ocean wave spectra by a band of randomly distributed ice floes
Montiel, F., V.A. Squire, and L.G. Benetts, Ann. Glaciol., 56, 315-322, doi:10.3189/2015AoG69A556, 2015. |
|
 |
|
Attenuation and directional spreading of ocean wave spectra in the marginal ice zone
Montiel, F., V.A. Squire, and L.G. Benetts, J. Fluid Mech., 790, 492-522, doi:10.1017/jfm.2016.21, 2016. |
|
 |
|
Comparison of viscoelastic-type models for ocean wave attenuation in ice-covered seas
Mosig, J.E.M., F. Montiel, and V.A. Squire, J. Geophys. Res., 120, 6072-6090, doi:10.1002/2015JC010881, 2015. |
|
 |
 |
|
Shipboard observations of the meteorology and near-surface environment during autumn freeze-up in the Beaufort/Chukchi seas Persson, P.O.G., B. Blomquist, P. Guest, S. Stammerjohn, C. Fairall, L. Rainville, B. Lund, S. Ackley, and J. Thomson, "Shipboard observations of the meteorology and near-surface environment during autumn freeze-up in the Beaufort/Chukchi seas," J. Geophys. Res., 123, 4930-4969, doi:10.1029/2018JC013786, 2018. |
|
More Info
| |
|
1 Jul 2018 
|
|
 |
|
|
The collection and processing of shipboard air, ice, and ocean measurements from the Sea State field campaign in the Beaufort/Chukchi Seas in autumn 2015 are described and the data used to characterize the nearâ€surface freezeup environment. The number of parameters measured or derived is large and the location and time of year are unique. Analysis was done of transits through the new, growing ice and of ice edge periods. Through differential surface energy fluxes, the presence of new, thin sea ice (<50 cm) produces lower tropospheric air temperatures in the ice interior that average ~4°C colder than those over open water near the ice edge, resulting in an ice edge baroclinic zone. This temperature difference doubles by late October and produces thermodynamic and dynamic feedbacks. These include offâ€ice, coldâ€air advection leading to enhanced surface heat loss averaging ~200 W/m2 over the open water, formation of lowâ€level jets, suppression of the ice edge baroclinic zone, and enhanced ice drift. The interior ice growth rate is thermodynamically consistent with a surface heat loss of ~65 W/m2 to the atmosphere and a heat flux of several tens of W/m2 from the ocean below. Ice drift at times contributes to the southward advance of the autumn ice edge through offâ€ice winds. The ocean thermohaline structure is highly variable and appears associated with bathymetric features, smallâ€scale upperâ€ocean eddies, and the growing ice cover. Lower salinity under the ice interior compared to the nearby ice edge is an upperâ€ocean impact of this thin ice cover.
|
|
 |
|
Quantifying growth of pancake sea ice floes using images from drifting buoys Roach, L., M. Smith, and S. Dean, "Quantifying growth of pancake sea ice floes using images from drifting buoys," J. Geophys. Res., 123, 2851-2866, doi:10.1002/2017JC013693, 2017. |
|
More Info
| |
|
1 Apr 2018 
|
|
 |
|
|
New sea ice in the polar regions often begins as small pancake floes in autumn and winter that grow laterally and weld together into larger floes. However, conditions in polar oceans during freezeâ€up are harsh, rendering inâ€situ observations of smallâ€scale sea ice growth processes difficult and infrequent. Here, we apply image processing techniques to images obtained by drifting wave buoys (SWIFTs) deployed in the autumn Arctic Ocean to quantify these processes in situ for the first time. Small pancake ice floes were observed to form and grow gradually in freezing, lowâ€wave conditions. We find that pancake floe diameters are limited by the wave field, such that floe diameter is proportional to wavelength and amplitude over time. Floe welding correlates well with sea ice concentration, and the observations can be used to estimate a key model parameter for floe size evolution. There is some agreement between observed lateral growth rates and those predicted using a theoretical model based on heat flux balance, but the model lateral growth rates are too conservative in these conditions. These results will be used to inform description of lateral floe growth and floe welding in new models that evolve sea ice floe size distribution.
|
|
|
An Arctic sea ice multi-step classification based on GNSS-R data from the TDS-1 mission
Rodriguez-Alvarez, N., B. Holt, S. Jaruwatanadilok, E. Podest, and K.C. Cavanaugh, Remote Sens Environ., 230, 111202, doi:10.1016/j.rse.2019.05.021, 2019. |
|
 |
 |
|
Dissipation of wind waves by pancake and frazil ice in the autumn Beaufort Sea Rogers, W.E., J. Thomson, H.H. Shen, M.J. Doble, P. Wadhams, and S. Cheng, "Dissipation of wind waves by pancake and frazil ice in the autumn Beaufort Sea," J. Geophys. Res., 121, 7991-8007, doi:10.1002/2016JC012251, 2016. |
|
More Info
| |
|
1 Nov 2016 
|
|
 |
|
|
A model for wind-generated surface gravity waves, WAVEWATCH III®, is used to analyze and interpret buoy measurements of wave spectra. The model is applied to a hindcast of a wave event in sea ice in the western Arctic, October 11–14 2015, for which extensive buoy and ship-borne measurements were made during a research cruise. The model, which uses a viscoelastic parameterization to represent the impact of sea ice on the waves, is found to have good skill — after calibration of the effective viscosity — for prediction of total energy, but over-predicts dissipation of high frequency energy by the sea ice. This shortcoming motivates detailed analysis of the apparent dissipation rate. A new inversion method is applied to yield, for each buoy spectrum, the inferred dissipation rate as a function of wave frequency. For 102 of the measured wave spectra, visual observations of the sea ice were available from buoy-mounted cameras, and ice categories (primarily for varying forms of pancake and frazil ice) are assigned to each based on the photographs. When comparing the inversion-derived dissipation profiles against the independently derived ice categories, there is remarkable correspondence, with clear sorting of dissipation profiles into groups of similar ice type. These profiles are largely monotonic: they do not exhibit the "roll-over" that has been found at high frequencies in some previous observational studies. This article is protected by copyright. All rights reserved.
|
|
|
Observations of the directional distribution of the wind energy input function over swell waves
Shabani, B., A.V. Babanin, and T.E. Baldock, J. Geophs. Res., 121, 1174-1193, doi:10.1002/2015JC011225, 2016. |
|
 |
 |
|
Episodic reversal of autumn ice advance caused by release of ocean heat in the Beaufort Sea Smith, M., S. Stammerjohn, O. Persson, L. Rainville, G. Liu, W. Perrie, R. Robertson, J. Jackson, and J. Thomson, "Episodic reversal of autumn ice advance caused by release of ocean heat in the Beaufort Sea," J. Geophys. Res., 123, 3164-3185, doi:10.1002/2018JC013764, 2018. |
|
More Info
| |
|
1 May 2018 
|
|
 |
|
|
Highâ€resolution measurements of the airâ€iceâ€ocean system during an October 2015 event in the Beaufort Sea demonstrate how stored ocean heat can be released to temporarily reverse seasonal ice advance. Strong onâ€ice winds over a vast fetch caused mixing and release of heat from the upper ocean. This heat was sufficient to melt large areas of thin, newly formed pancake ice; an average of 10 MJ/m2 was lost from the upper ocean in the study area, resulting in ~3–5 cm pancake sea ice melt. Heat and salt budgets create a consistent picture of the evolving airâ€iceâ€ocean system during this event, in both a fixed and iceâ€following (Lagrangian) reference frame. The heat lost from the upper ocean is large compared with prior observations of ocean heat flux under thick, multiâ€year Arctic sea ice. In contrast to prior studies, where almost all heat lost goes into ice melt, a significant portion of the ocean heat released in this event goes directly to the atmosphere, while the remainder (~30–40%) goes into melting sea ice. The magnitude of ocean mixing during this event may have been enhanced by large surface waves, reaching nearly 5 m at the peak, which are becoming increasingly common in the autumn Arctic Ocean. The wave effects are explored by comparing the airâ€iceâ€ocean evolution observed at short and long fetches, and a common scaling for Langmuir turbulence. After the event, the ocean mixed layer was deeper and cooler, and autumn ice formation resumed.
|
|
 |
|
Ocean surface turbulence in newly formed marginal ice zones Smith, M., and J. Thomson, "Ocean surface turbulence in newly formed marginal ice zones," J. Geophys. Res., 124, 1382-1398, doi:10.1029/2018JC014405, 2019. |
|
More Info
| |
|
1 Mar 2019 
|
|
 |
|
|
Nearâ€surface turbulent kinetic energy dissipation rates are altered by the presence of sea ice in the marginal ice zone, with significant implications for exchanges at the airâ€iceâ€ocean interface. Observations spanning a range of conditions are used to parameterize dissipation rates in marginal ice zones with relatively thin, newly formed ice, and two regimes are identified. In both regimes, the turbulent dissipation rates are matched to the turbulent input rate, which is formulated as the surface stress acting on roughness elements moving at an effective transfer velocity. In marginal ice zones with waves, the short waves are the roughness elements, and the phase speed of these waves is the effective transfer velocity. The wave amplitudes are attenuated by the ice, and thus, the size of the roughness elements is reduced; this is parameterized as a reduction in the effective transfer velocity. When waves are sufficiently small, the ice floes are the roughness elements, and the relative velocity between the sea ice and the ocean is the effective transfer velocity. A scaling is introduced to determine the appropriate transfer velocity in a marginal ice zone based on wave height, ice thickness and concentration, and iceâ€ocean shear. The results suggest that turbulence underneath new sea ice is mostly related to the wind forcing and that marginal ice zones generally have less turbulence than the open ocean under similar wind forcing.
|
|
 |
|
Pancake sea ice kinematics and dynamics using shipboard stereo video Smith, M., and J. Thomson, "Pancake sea ice kinematics and dynamics using shipboard stereo video," Ann. Glaciol., 61, doi:10.1017/aog.2019.35, 2020. |
|
More Info
| |
|
1 Sep 2020 
|
|
 |
|
|
In the marginal ice zone, surface waves drive motion of sea ice floes. The motion of floes relative to each other can cause periodic collisions, and drives the formation of pancake sea ice. Additionally, the motion of floes relative to the water results in turbulence generation at the interface between the ice and ocean below. These are important processes for the formation and growth of pancakes, and likely contribute to wave energy loss. Models and laboratory studies have been used to describe these motions, but there have been no in situ observations of relative ice velocities in a natural wave field. Here, we use shipboard stereo video to measure wave motion and relative motion of pancake floes simultaneously. The relative velocities of pancake floes are typically small compared to wave orbital motion (i.e. floes mostly follow the wave orbits). We find that relative velocities are well-captured by existing phase-resolved models, and are only somewhat over-estimated by using bulk wave parameters. Under the conditions observed, estimates of wave energy loss from ice–ocean turbulence are much larger than from pancake collisions. Increased relative pancake floe velocities in steeper wave fields may then result in more wave attenuation by increasing ice–ocean shear.
|
|
|
Evolution of directional wave spectra in the marginal ice zone: A new model tested with legacy data
Squire, V.A., and F. Montiel, J. Phys. Oceanogr., 46, 3121-3137, doi:10.1175/JPO-D-16-0118.1, 2016. |
|
 |
|
Wave climate in the Arctic 1992–2014: Seasonality and trends
Stopa, J.E., F. Ardhuin, and F. Girard-Ardhuin, The Cryosphere, 10, 1605-1629, doi:10.5194/tc-10-1605-2016, 2016. |
|
 |
 |
|
Wave attenuation through an arctic marginal ice zone on 12 October 2015. 1. Measurement of wave spectra and ice features from Sentinel 1A Stopa, J.E., F. Ardhuin, J. Thomson, M.M. Smith, A. Kohout, M. Doble, and P. Wadhams, "Wave attenuation through an arctic marginal ice zone on 12 October 2015. 1. Measurement of wave spectra and ice features from Sentinel 1A," J. Geophys. Res., 123, 3619-3634, doi:10.1029/2018JC013791, 2018. |
|
More Info
| |
|
1 May 2018 
|
|
 |
|
|
A storm with significant wave heights exceeding 4 m occurred in the Beaufort Sea on 11–13 October 2015. The waves and ice were captured on 12 October by the Synthetic Aperture Radar (SAR) on board Sentinelâ€1A, with Interferometric Wide swath images covering 400 x 1,100 km at 10 m resolution. This data set allows the estimation of wave spectra across the marginal ice zone (MIZ) every 5 km, over 400 km of sea ice. Since ice attenuates waves with wavelengths shorter than 50 m in a few kilometers, the longer waves are clearly imaged by SAR in sea ice. Obtaining wave spectra from the image requires a careful estimation of the blurring effect produced by unresolved wavelengths in the azimuthal direction. Using in situ wave buoy measurements as reference, we establish that this azimuth cutoff can be estimated in mixed oceanâ€ice conditions. Wave spectra could not be estimated where ice features such as leads contribute to a large fraction of the radar backscatter variance. The resulting wave height map exhibits a steep decay in the first 100 km of ice, with a transition into a weaker decay further away. This unique wave decay pattern transitions where largeâ€scale ice features such as leads become visible. As in situ ice information is limited, it is not known whether the decay is caused by a difference in ice properties or a wave dissipation mechanism. The implications of the observed wave patterns are discussed in the context of other observations.
|
|
|
Using time of ice retreat to predict timing of fall freeze-up in the Arctic
Stroeve, J.C., A.D. Crawford, and S. Stammerjohn, Geophys. Res. Lett., 43, 6332-6340, doi:10.1002/2016GL069314, 2016. |
|
 |
 |
|
Emerging trends in the sea state of the Beaufort and Chukchi seas Thomson, J., et al., "Emerging trends in the sea state of the Beaufort and Chukchi seas," Ocean Modell., 105, doi:10.1016/j.ocemod.2016.02.009, 2016. |
|
More Info
| |
|
1 Sep 2016 
|
|
 |
|
|
The sea state of the Beaufort and Chukchi seas is controlled by the wind forcing and the amount of ice-free water available to generate surface waves. Clear trends in the annual duration of the open water season and in the extent of the seasonal sea ice minimum suggest that the sea state should be increasing, independent of changes in the wind forcing. Wave model hindcasts from four selected years spanning recent conditions are consistent with this expectation. In particular, larger waves are more common in years with less summer sea ice and/or a longer open water season, and peak wave periods are generally longer. The increase in wave energy may affect both the coastal zones and the remaining summer ice pack, as well as delay the autumn ice-edge advance. However, trends in the amount of wave energy impinging on the ice-edge are inconclusive, and the associated processes, especially in the autumn period of new ice formation, have yet to be well-described by in situ observations. There is an implicit trend and evidence for increasing wave energy along the coast of northern Alaska, and this coastal signal is corroborated by satellite altimeter estimates of wave energy.
|
|
 |
|
Wave groups observed in pancake sea ice Thomson, J., J. Gemmrich, W.E. Rogers, C.O. Collins, and F. Ardhuin, "Wave groups observed in pancake sea ice," J. Geophys. Res., 124, 7400-7411, doi:10.1029/2019JC015354, 2019. |
|
More Info
| |
|
1 Nov 2019 
|
|
 |
|
|
Ocean surface waves propagating through sea ice are scattered and dissipated. The net attenuation occurs preferentially at the higher frequencies, and thus the spectral bandwidth of a given wave field is reduced, relative to open water. The reduction in bandwidth is associated with an increase in the groupiness of the wave field. Using SWIFT buoy data from the 2015 Arctic Sea State experiment, bandwidth is compared between pancake ice and open water conditions, and the linkage to group envelopes is explored. The enhancement of wave groups in ice is consistent with the simple linear mechanism of superposition of waves with narrowing spectral bandwidth. This is confirmed using synthetic data. Nonlinear mechanisms, which have been shown as significant in other ice types, are not found to be important in this data set.
|
|
 |
|
Spurious rollover of wave attenuation rates in sea ice caused by noise in field measurements Thomson, J., Hošeková, L., M.H. Meylan, A.L. Kohout, and N. Kumar, "Spurious rollover of wave attenuation rates in sea ice caused by noise in field measurements," J. Geophys. Res., 126, doi:10.1029/2020JC016606, 2021. |
|
More Info
| |
|
1 Mar 2021 
|
|
 |
|
|
The effects of instrument noise on estimating the spectral attenuation rates of ocean waves in sea ice are explored using synthetic observations in which the true attenuation rates are known explicitly. The spectral shape of the energy added by noise, relative to the spectral shape of the true wave energy, is the critical aspect of the investigation. A negative bias in attenuation that grows in frequency is found across a range of realistic parameters. This negative bias decreases the observed attenuation rates at high frequencies, such that it can explain the rollover effect commonly reported in field studies of wave attenuation in sea ice. The published results from five field experiments are evaluated in terms of the noise bias, and a spurious rollover (or flattening) of attenuation is found in all cases. Remarkably, the wave heights are unaffected by the noise bias, because the noise bias occurs at frequencies that contain only a small fraction of the total energy.
|
|
 |
|
Swell and sea in the emerging Arctic Ocean Thomson, J., and W.E. Rogers, "Swell and sea in the emerging Arctic Ocean," Geophys. Res. Lett., 41, 3136-3140, doi:10.1002/2014GL059983, 2014. |
|
More Info
| |
|
16 May 2014 
|
|
 |
|
|
Ocean surface waves (sea and swell) are generated by winds blowing over a distance (fetch) for a duration of time. In the Arctic Ocean, fetch varies seasonally from essentially zero in winter to hundreds of kilometers in recent summers. Using in situ observations of waves in the central Beaufort Sea, combined with a numerical wave model and satellite sea ice observations, we show that wave energy scales with fetch throughout the seasonal ice cycle. Furthermore, we show that the increased open water of 2012 allowed waves to develop beyond pure wind seas and evolve into swells. The swells remain tied to the available fetch, however, because fetch is a proxy for the basin size in which the wave evolution occurs. Thus, both sea and swell depend on the open water fetch in the Arctic, because the swell is regionally driven. This suggests that further reductions in seasonal ice cover in the future will result in larger waves, which in turn provide a mechanism to break up sea ice and accelerate ice retreat.
|
|
 |
|
Wind and wave influences on sea ice floe size and leads in the Beaufort and Chukchi seas during the summer-fall transition 2014 Wang, Y., B. Holt, W.E. Rogers, J. Thomson, and H.H. Shen, "Wind and wave influences on sea ice floe size and leads in the Beaufort and Chukchi seas during the summer-fall transition 2014," J. Geophys. Res., 121, 1502-1525, doi:10.1002/2015JC011349, 2016. |
|
More Info
| |
|
20 Feb 2016 
|
|
 |
|
|
Sea ice floe size distribution and lead properties in the Beaufort and Chukchi Seas are studied in the summer-fall transition 2014 to examine the impact on the sea ice cover from storms and surface waves. Floe size distributions are analyzed from MEDEA, Landsat8, and RADARSAT-2 imagery, with a resolution span of 1–100 m. Landsat8 imagery is also used to identify the orientation and spacing of leads. The study period centers around three large wave events during August–September 2014 identified by SWIFT buoys and WAVEWATCH III model data. The range of floe sizes from different resolutions provides the overall distribution across a wide range of ice properties and estimated thickness. All cumulative floe size distribution curves show a gradual bending toward shallower slopes for smaller floe sizes. The overall slopes in the cumulative floe size distribution curves from Landsat8 images are lower than, while those from RADARSAT-2 are similar to, previously reported results in the same region and seasonal period. The MEDEA floe size distributions appeared to be sensitive to the passage of storms. Lead orientations, regardless of length, correlate slightly better with the peak wave direction than with the mean wave direction. Their correlation with the geostrophic wind is stronger than with the surface wind. The spacing between shorter leads correlates well with the local incoming surface wavelengths, obtained from the model peak wave frequency. The information derived shows promise for a coordinated multisensor study of storm effects in the Arctic marginal ice zone.
|
|
|
A diffusion approximation for ocean wave scatterings by randomly distributed ice floes
Zhao, X., and H. Shen, Ocean Model., 107, 21-27, doi:10.1016/j.ocemod.2016.09.014, 2016. |
|
 |
|
Observations-based source terms in the third-generation wave model WAVEWATCH III
Zieger, S., A.V. Babanin, W.E. Rogers, and I.R. Young, Ocean Model., 96, 2-25, doi:10.1016/j.ocemod.2015.07.014, 2015. |
|
 |
|
|


